
HYROX Tampa 2026 results
2,634 finishes so far. Find your name for your race report.
Find your result
| Race day | # | Athlete | Age group | Time |
|---|
Provisional lists, by race day. Tap your name for your full race report. Places are provisional and will still move: more start groups still to race over the next 2 days.
Pick your race day
Finish times, Open · Thursday
This chart shows how many athletes finished in each 2.5-minute band, fastest on the left.A widely spread field with a long slow tail: typical 1:37:32, middle half about 1:25:19 to 1:52:25, fastest 10% (green) under 1:17:46.
See the numbers
| Time band | How many | Share |
|---|---|---|
| 57:30 to 1:00:00 | 1 | 0.1% |
| 1:00:00 to 1:02:30 | 0 | 0.0% |
| 1:02:30 to 1:05:00 | 5 | 0.5% |
| 1:05:00 to 1:07:30 | 8 | 0.8% |
| 1:07:30 to 1:10:00 | 15 | 1.5% |
| 1:10:00 to 1:12:30 | 17 | 1.7% |
| 1:12:30 to 1:15:00 | 22 | 2.2% |
| 1:15:00 to 1:17:30 | 31 | 3.0% |
| 1:17:30 to 1:20:00 | 52 | 5.1% |
| 1:20:00 to 1:22:30 | 42 | 4.1% |
| 1:22:30 to 1:25:00 | 54 | 5.3% |
| 1:25:00 to 1:27:30 | 62 | 6.1% |
| 1:27:30 to 1:30:00 | 49 | 4.8% |
| 1:30:00 to 1:32:30 | 48 | 4.7% |
| 1:32:30 to 1:35:00 | 62 | 6.1% |
| 1:35:00 to 1:37:30 | 43 | 4.2% |
| 1:37:30 to 1:40:00 | 49 | 4.8% |
| 1:40:00 to 1:42:30 | 49 | 4.8% |
| 1:42:30 to 1:45:00 | 42 | 4.1% |
| 1:45:00 to 1:47:30 | 43 | 4.2% |
| 1:47:30 to 1:50:00 | 42 | 4.1% |
| 1:50:00 to 1:52:30 | 30 | 2.9% |
| 1:52:30 to 1:55:00 | 33 | 3.2% |
| 1:55:00 to 1:57:30 | 30 | 2.9% |
| 1:57:30 to 2:00:00 | 15 | 1.5% |
| 2:00:00 to 2:02:30 | 20 | 2.0% |
| 2:02:30 to 2:05:00 | 11 | 1.1% |
| 2:05:00 to 2:07:30 | 24 | 2.4% |
| 2:07:30 to 2:10:00 | 16 | 1.6% |
| 2:10:00 to 2:12:30 | 9 | 0.9% |
| 2:12:30 to 2:15:00 | 10 | 1.0% |
| 2:15:00 to 2:17:30 | 8 | 0.8% |
| 2:17:30 to 2:20:00 | 10 | 1.0% |
| 2:20:00 to 2:22:30 | 10 | 1.0% |
| 2:22:30 to 2:25:00 | 6 | 0.6% |
| 2:25:00 to 2:27:30 | 9 | 0.9% |
| 2:27:30 to 2:30:00 | 8 | 0.8% |
| 2:30:00 to 2:32:30 | 8 | 0.8% |
| 2:32:30 to 2:35:00 | 5 | 0.5% |
| 2:35:00 to 2:37:30 | 4 | 0.4% |
| 2:37:30 to 2:40:00 | 3 | 0.3% |
| 2:40:00 to 2:42:30 | 2 | 0.2% |
| 2:42:30 to 2:45:00 | 0 | 0.0% |
| 2:45:00 to 2:47:30 | 2 | 0.2% |
| 2:47:30 to 2:50:00 | 3 | 0.3% |
| 2:50:00 to 2:52:30 | 2 | 0.2% |
| 2:52:30 to 2:55:00 | 0 | 0.0% |
| 2:55:00 to 2:57:30 | 0 | 0.0% |
| 2:57:30 to 3:00:00 | 2 | 0.2% |
| 3:00:00 to 3:02:30 | 0 | 0.0% |
| 3:02:30 to 3:05:00 | 1 | 0.1% |
| 3:05:00 to 3:07:30 | 1 | 0.1% |
| 3:07:30 to 3:10:00 | 0 | 0.0% |
| 3:10:00 to 3:12:30 | 0 | 0.0% |
| 3:12:30 to 3:15:00 | 1 | 0.1% |
| 3:15:00 to 3:17:30 | 0 | 0.0% |
| 3:17:30 to 3:20:00 | 1 | 0.1% |
How to read
Each bar is how many finished in that time slot, fastest on the left, men and women together. Green is the fastest 10%; the line is the typical finish.
| # | Athlete | Age group | Time | |
|---|---|---|---|---|
| 1 | Zach Cygan USA | 16-24 | 57:48 | |
| 2 | Nicole Scales USA | 25-29 | 1:02:41 | |
| 3 | Lauren Tunnell USA | 16-24 | 1:02:44 | |
| 4 | Rowan Billings USA | 16-24 | 1:03:13 | |
| 5 | Wynn Griffin USA | 35-39 | 1:03:30 | |
| 6 | Jake Lampe USA | 25-29 | 1:04:01 | |
| 7 | Benjamin Kosinski USA | 35-39 | 1:05:51 | |
| 8 | Anthony Aguilera USA | 35-39 | 1:06:07 | |
| 9 | Bianca Toledo USA | 30-34 | 1:06:16 | |
| 10 | Caden Cribbs USA | 16-24 | 1:06:41 | |
| 11 | Sean Feilen USA | 40-44 | 1:06:44 | |
| 12 | Reanna Jereb USA | 30-34 | 1:06:51 | |
| 13 | Matthew Baysinger USA | 40-44 | 1:07:00 | |
| 14 | Ryan Haxel USA | 30-34 | 1:07:19 | |
| 15 | Corey Leach USA | 35-39 | 1:07:31 | |
| 16 | Mitchell Gaffney USA | 35-39 | 1:07:34 | |
| 17 | Brett Swindle USA | 40-44 | 1:07:39 | |
| 18 | Cameron Brate USA | 35-39 | 1:07:52 | |
| 19 | Cara Gillis CAN | 35-39 | 1:08:07 | |
| 20 | Gabriela Toledo USA | 30-34 | 1:08:08 | |
| 21 | Zoe Verkerke USA | 30-34 | 1:08:23 | |
| 22 | Robert Herold USA | 35-39 | 1:08:31 | |
| 23 | Ryan Henrich USA | 40-44 | 1:08:39 | |
| 24 | Linzie Arnett USA | 35-39 | 1:08:55 | |
| 25 | Yuliano Rodriguez PUR | 30-34 | 1:09:13 | |
| 26 | Treyson Gordon USA | 25-29 | 1:09:16 | |
| 27 | Kyle Treen USA | 40-44 | 1:09:42 | |
| 28 | Alexa Moccia USA | 35-39 | 1:09:45 | |
| 29 | Nick Atkins USA | 25-29 | 1:09:51 | |
| 30 | Joshua Gasbarro USA | 35-39 | 1:10:02 | |
| 31 | Emily Lausch USA | 30-34 | 1:10:16 | |
| 32 | Abi Kasper USA | 30-34 | 1:10:46 | |
| 33 | Xiteng Lin CHN | 25-29 | 1:10:50 | |
| 34 | Sarah Krolick USA | 30-34 | 1:10:57 | |
| 35 | Chengcheng Xu CHN | 16-24 | 1:10:58 | |
| 36 | BRIAN YU USA | 40-44 | 1:10:58 | |
| 37 | Oliver Grove USA | 16-24 | 1:11:13 | |
| 38 | Hillary Pera USA | 35-39 | 1:11:14 | |
| 39 | Nicole Hilton USA | 30-34 | 1:11:15 | |
| 40 | Jason Rosales USA | 30-34 | 1:11:16 | |
| 41 | Julia Listro CAN | 25-29 | 1:11:38 | |
| 42 | Sean Simmons CAN | 50-54 | 1:11:46 | |
| 43 | Meron Ogbe CAN | 30-34 | 1:11:53 | |
| 44 | Alexa Fisher USA | 30-34 | 1:12:09 | |
| 45 | Leland Frataccia USA | 60-64 | 1:12:20 | |
| 46 | Liesl Scherrer USA | 16-24 | 1:12:21 | |
| 47 | William Flynn USA | 25-29 | 1:12:46 | |
| 48 | Kathryn Vorkapich USA | 45-49 | 1:13:04 | |
| 49 | José Eduardo Martinez Rodriguez MEX | 30-34 | 1:13:07 | |
| 50 | Kevin Rodriguez USA | 16-24 | 1:13:09 |
Or type your name above.
Finish times, Doubles · Thursday
This chart shows how many athletes finished in each 2.5-minute band, fastest on the left.A field of normal spread: typical 1:26:38, middle half about 1:17:36 to 1:38:09, fastest 10% (green) under 1:10:48.
See the numbers
| Time band | How many | Share |
|---|---|---|
| 52:30 to 55:00 | 1 | 0.1% |
| 55:00 to 57:30 | 4 | 0.2% |
| 57:30 to 1:00:00 | 10 | 0.6% |
| 1:00:00 to 1:02:30 | 8 | 0.5% |
| 1:02:30 to 1:05:00 | 26 | 1.6% |
| 1:05:00 to 1:07:30 | 40 | 2.5% |
| 1:07:30 to 1:10:00 | 50 | 3.1% |
| 1:10:00 to 1:12:30 | 71 | 4.4% |
| 1:12:30 to 1:15:00 | 94 | 5.8% |
| 1:15:00 to 1:17:30 | 94 | 5.8% |
| 1:17:30 to 1:20:00 | 102 | 6.3% |
| 1:20:00 to 1:22:30 | 109 | 6.8% |
| 1:22:30 to 1:25:00 | 123 | 7.6% |
| 1:25:00 to 1:27:30 | 108 | 6.7% |
| 1:27:30 to 1:30:00 | 94 | 5.8% |
| 1:30:00 to 1:32:30 | 96 | 6.0% |
| 1:32:30 to 1:35:00 | 82 | 5.1% |
| 1:35:00 to 1:37:30 | 79 | 4.9% |
| 1:37:30 to 1:40:00 | 58 | 3.6% |
| 1:40:00 to 1:42:30 | 64 | 4.0% |
| 1:42:30 to 1:45:00 | 38 | 2.4% |
| 1:45:00 to 1:47:30 | 50 | 3.1% |
| 1:47:30 to 1:50:00 | 39 | 2.4% |
| 1:50:00 to 1:52:30 | 22 | 1.4% |
| 1:52:30 to 1:55:00 | 20 | 1.2% |
| 1:55:00 to 1:57:30 | 31 | 1.9% |
| 1:57:30 to 2:00:00 | 22 | 1.4% |
| 2:00:00 to 2:02:30 | 18 | 1.1% |
| 2:02:30 to 2:05:00 | 18 | 1.1% |
| 2:05:00 to 2:07:30 | 6 | 0.4% |
| 2:07:30 to 2:10:00 | 5 | 0.3% |
| 2:10:00 to 2:12:30 | 4 | 0.2% |
| 2:12:30 to 2:15:00 | 3 | 0.2% |
| 2:15:00 to 2:17:30 | 3 | 0.2% |
| 2:17:30 to 2:20:00 | 3 | 0.2% |
| 2:20:00 to 2:22:30 | 3 | 0.2% |
| 2:22:30 to 2:25:00 | 0 | 0.0% |
| 2:25:00 to 2:27:30 | 1 | 0.1% |
| 2:27:30 to 2:30:00 | 3 | 0.2% |
| 2:30:00 to 2:32:30 | 1 | 0.1% |
| 2:32:30 to 2:35:00 | 0 | 0.0% |
| 2:35:00 to 2:37:30 | 0 | 0.0% |
| 2:37:30 to 2:40:00 | 0 | 0.0% |
| 2:40:00 to 2:42:30 | 0 | 0.0% |
| 2:42:30 to 2:45:00 | 1 | 0.1% |
| 2:45:00 to 2:47:30 | 1 | 0.1% |
| 2:47:30 to 2:50:00 | 0 | 0.0% |
| 2:50:00 to 2:52:30 | 1 | 0.1% |
| 2:52:30 to 2:55:00 | 0 | 0.0% |
| 2:55:00 to 2:57:30 | 0 | 0.0% |
| 2:57:30 to 3:00:00 | 1 | 0.1% |
| 3:00:00 to 3:02:30 | 0 | 0.0% |
| 3:02:30 to 3:05:00 | 0 | 0.0% |
| 3:05:00 to 3:07:30 | 0 | 0.0% |
| 3:07:30 to 3:10:00 | 0 | 0.0% |
| 3:10:00 to 3:12:30 | 1 | 0.1% |
How to read
Each bar is how many finished in that time slot, fastest on the left, men and women together. Green is the fastest 10%; the line is the typical finish.
Or type your name above.
2 finishers in so far: too few for a typical time, so here is the list.
| # | Athlete | Age group | Time | |
|---|---|---|---|---|
| 1 | Sarina Babb USA | Lower Limb Minor | 2:23:48 | |
| 2 | Francisco Oller Garcia PUR | Seated Without Hip Function | 2:34:52 |
The times to beat at Tampa
This chart shows how many athletes finished in each 2.5-minute band, fastest on the left.A widely spread field with a long slow tail: typical 1:27:57, middle half about 1:17:50 to 1:41:27, fastest 10% (green) under 1:10:39.The marked line is fastest 25%: 1:17:51. The busiest band was 1:17:30 to 1:20:00.
See the numbers
| Time band | How many | Share |
|---|---|---|
| 50:00 to 52:30 | 4 | 0.0% |
| 52:30 to 55:00 | 58 | 0.0% |
| 55:00 to 57:30 | 289 | 0.1% |
| 57:30 to 1:00:00 | 1,281 | 0.4% |
| 1:00:00 to 1:02:30 | 2,745 | 0.9% |
| 1:02:30 to 1:05:00 | 5,115 | 1.6% |
| 1:05:00 to 1:07:30 | 7,526 | 2.4% |
| 1:07:30 to 1:10:00 | 11,165 | 3.6% |
| 1:10:00 to 1:12:30 | 13,236 | 4.2% |
| 1:12:30 to 1:15:00 | 16,541 | 5.3% |
| 1:15:00 to 1:17:30 | 17,709 | 5.6% |
| 1:17:30 to 1:20:00 | 19,740 | 6.3% |
| 1:20:00 to 1:22:30 | 19,293 | 6.2% |
| 1:22:30 to 1:25:00 | 19,688 | 6.3% |
| 1:25:00 to 1:27:30 | 18,946 | 6.0% |
| 1:27:30 to 1:30:00 | 18,766 | 6.0% |
| 1:30:00 to 1:32:30 | 16,101 | 5.1% |
| 1:32:30 to 1:35:00 | 15,164 | 4.8% |
| 1:35:00 to 1:37:30 | 13,257 | 4.2% |
| 1:37:30 to 1:40:00 | 12,321 | 3.9% |
| 1:40:00 to 1:42:30 | 10,565 | 3.4% |
| 1:42:30 to 1:45:00 | 9,448 | 3.0% |
| 1:45:00 to 1:47:30 | 8,432 | 2.7% |
| 1:47:30 to 1:50:00 | 7,171 | 2.3% |
| 1:50:00 to 1:52:30 | 6,372 | 2.0% |
| 1:52:30 to 1:55:00 | 5,621 | 1.8% |
| 1:55:00 to 1:57:30 | 4,919 | 1.6% |
| 1:57:30 to 2:00:00 | 4,191 | 1.3% |
| 2:00:00 to 2:02:30 | 3,475 | 1.1% |
| 2:02:30 to 2:05:00 | 3,093 | 1.0% |
| 2:05:00 to 2:07:30 | 2,672 | 0.9% |
| 2:07:30 to 2:10:00 | 2,323 | 0.7% |
| 2:10:00 to 2:12:30 | 2,048 | 0.7% |
| 2:12:30 to 2:15:00 | 1,825 | 0.6% |
| 2:15:00 to 2:17:30 | 1,575 | 0.5% |
| 2:17:30 to 2:20:00 | 1,390 | 0.4% |
| 2:20:00 to 2:22:30 | 1,177 | 0.4% |
| 2:22:30 to 2:25:00 | 1,011 | 0.3% |
| 2:25:00 to 2:27:30 | 872 | 0.3% |
| 2:27:30 to 2:30:00 | 795 | 0.3% |
| 2:30:00 to 2:32:30 | 636 | 0.2% |
| 2:32:30 to 2:35:00 | 558 | 0.2% |
| 2:35:00 to 2:37:30 | 538 | 0.2% |
| 2:37:30 to 2:40:00 | 493 | 0.2% |
| 2:40:00 to 2:42:30 | 370 | 0.1% |
| 2:42:30 to 2:45:00 | 363 | 0.1% |
| 2:45:00 to 2:47:30 | 329 | 0.1% |
| 2:47:30 to 2:50:00 | 282 | 0.1% |
| 2:50:00 to 2:52:30 | 235 | 0.1% |
| 2:52:30 to 2:55:00 | 249 | 0.1% |
| 2:55:00 to 2:57:30 | 172 | 0.1% |
| 2:57:30 to 3:00:00 | 150 | 0.0% |
| 3:00:00 to 3:02:30 | 138 | 0.0% |
| 3:02:30 to 3:05:00 | 135 | 0.0% |
| 3:05:00 to 3:07:30 | 115 | 0.0% |
| 3:07:30 to 3:10:00 | 98 | 0.0% |
| 3:10:00 to 3:12:30 | 95 | 0.0% |
| 3:12:30 to 3:15:00 | 61 | 0.0% |
| 3:15:00 to 3:17:30 | 71 | 0.0% |
| 3:17:30 to 3:20:00 | 436 | 0.1% |
This chart shows how many athletes finished in each 2.5-minute band, fastest on the left.A field of normal spread with a long slow tail: typical 1:35:59, middle half about 1:25:42 to 1:49:57, fastest 10% (green) under 1:18:23.The marked line is fastest 25%: 1:25:42. The busiest band was 1:27:30 to 1:30:00.
See the numbers
| Time band | How many | Share |
|---|---|---|
| 55:00 to 57:30 | 3 | 0.0% |
| 57:30 to 1:00:00 | 24 | 0.0% |
| 1:00:00 to 1:02:30 | 69 | 0.0% |
| 1:02:30 to 1:05:00 | 282 | 0.2% |
| 1:05:00 to 1:07:30 | 755 | 0.4% |
| 1:07:30 to 1:10:00 | 1,599 | 0.9% |
| 1:10:00 to 1:12:30 | 2,711 | 1.5% |
| 1:12:30 to 1:15:00 | 4,038 | 2.3% |
| 1:15:00 to 1:17:30 | 5,710 | 3.2% |
| 1:17:30 to 1:20:00 | 7,529 | 4.3% |
| 1:20:00 to 1:22:30 | 8,426 | 4.8% |
| 1:22:30 to 1:25:00 | 9,878 | 5.6% |
| 1:25:00 to 1:27:30 | 10,718 | 6.1% |
| 1:27:30 to 1:30:00 | 11,206 | 6.4% |
| 1:30:00 to 1:32:30 | 10,505 | 6.0% |
| 1:32:30 to 1:35:00 | 10,425 | 5.9% |
| 1:35:00 to 1:37:30 | 10,055 | 5.7% |
| 1:37:30 to 1:40:00 | 9,217 | 5.2% |
| 1:40:00 to 1:42:30 | 8,302 | 4.7% |
| 1:42:30 to 1:45:00 | 7,602 | 4.3% |
| 1:45:00 to 1:47:30 | 6,861 | 3.9% |
| 1:47:30 to 1:50:00 | 6,190 | 3.5% |
| 1:50:00 to 1:52:30 | 5,451 | 3.1% |
| 1:52:30 to 1:55:00 | 4,869 | 2.8% |
| 1:55:00 to 1:57:30 | 4,242 | 2.4% |
| 1:57:30 to 2:00:00 | 3,689 | 2.1% |
| 2:00:00 to 2:02:30 | 3,087 | 1.8% |
| 2:02:30 to 2:05:00 | 2,858 | 1.6% |
| 2:05:00 to 2:07:30 | 2,375 | 1.3% |
| 2:07:30 to 2:10:00 | 2,109 | 1.2% |
| 2:10:00 to 2:12:30 | 1,884 | 1.1% |
| 2:12:30 to 2:15:00 | 1,641 | 0.9% |
| 2:15:00 to 2:17:30 | 1,449 | 0.8% |
| 2:17:30 to 2:20:00 | 1,283 | 0.7% |
| 2:20:00 to 2:22:30 | 1,086 | 0.6% |
| 2:22:30 to 2:25:00 | 993 | 0.6% |
| 2:25:00 to 2:27:30 | 875 | 0.5% |
| 2:27:30 to 2:30:00 | 731 | 0.4% |
| 2:30:00 to 2:32:30 | 591 | 0.3% |
| 2:32:30 to 2:35:00 | 588 | 0.3% |
| 2:35:00 to 2:37:30 | 536 | 0.3% |
| 2:37:30 to 2:40:00 | 437 | 0.2% |
| 2:40:00 to 2:42:30 | 369 | 0.2% |
| 2:42:30 to 2:45:00 | 341 | 0.2% |
| 2:45:00 to 2:47:30 | 277 | 0.2% |
| 2:47:30 to 2:50:00 | 235 | 0.1% |
| 2:50:00 to 2:52:30 | 242 | 0.1% |
| 2:52:30 to 2:55:00 | 206 | 0.1% |
| 2:55:00 to 2:57:30 | 161 | 0.1% |
| 2:57:30 to 3:00:00 | 156 | 0.1% |
| 3:00:00 to 3:02:30 | 120 | 0.1% |
| 3:02:30 to 3:05:00 | 105 | 0.1% |
| 3:05:00 to 3:07:30 | 95 | 0.1% |
| 3:07:30 to 3:10:00 | 77 | 0.0% |
| 3:10:00 to 3:12:30 | 93 | 0.1% |
| 3:12:30 to 3:15:00 | 58 | 0.0% |
| 3:15:00 to 3:17:30 | 59 | 0.0% |
| 3:17:30 to 3:20:00 | 488 | 0.3% |
This chart shows how many athletes finished in each 2.5-minute band, fastest on the left.A field of normal spread with a long slow tail: typical 1:16:24, middle half about 1:08:57 to 1:25:58, fastest 10% (green) under 1:03:28.The marked line is fastest 25%: 1:08:58. The busiest band was 1:12:30 to 1:15:00.
See the numbers
| Time band | How many | Share |
|---|---|---|
| 47:30 to 50:00 | 25 | 0.0% |
| 50:00 to 52:30 | 172 | 0.1% |
| 52:30 to 55:00 | 728 | 0.4% |
| 55:00 to 57:30 | 2,066 | 1.1% |
| 57:30 to 1:00:00 | 4,905 | 2.6% |
| 1:00:00 to 1:02:30 | 7,259 | 3.8% |
| 1:02:30 to 1:05:00 | 10,233 | 5.4% |
| 1:05:00 to 1:07:30 | 12,980 | 6.9% |
| 1:07:30 to 1:10:00 | 15,303 | 8.1% |
| 1:10:00 to 1:12:30 | 16,009 | 8.5% |
| 1:12:30 to 1:15:00 | 16,111 | 8.5% |
| 1:15:00 to 1:17:30 | 15,211 | 8.1% |
| 1:17:30 to 1:20:00 | 14,107 | 7.5% |
| 1:20:00 to 1:22:30 | 12,286 | 6.5% |
| 1:22:30 to 1:25:00 | 10,704 | 5.7% |
| 1:25:00 to 1:27:30 | 9,103 | 4.8% |
| 1:27:30 to 1:30:00 | 7,779 | 4.1% |
| 1:30:00 to 1:32:30 | 6,103 | 3.2% |
| 1:32:30 to 1:35:00 | 5,133 | 2.7% |
| 1:35:00 to 1:37:30 | 4,140 | 2.2% |
| 1:37:30 to 1:40:00 | 3,405 | 1.8% |
| 1:40:00 to 1:42:30 | 2,743 | 1.5% |
| 1:42:30 to 1:45:00 | 2,240 | 1.2% |
| 1:45:00 to 1:47:30 | 1,843 | 1.0% |
| 1:47:30 to 1:50:00 | 1,516 | 0.8% |
| 1:50:00 to 1:52:30 | 1,213 | 0.6% |
| 1:52:30 to 1:55:00 | 1,022 | 0.5% |
| 1:55:00 to 1:57:30 | 850 | 0.5% |
| 1:57:30 to 2:00:00 | 650 | 0.3% |
| 2:00:00 to 2:02:30 | 458 | 0.2% |
| 2:02:30 to 2:05:00 | 422 | 0.2% |
| 2:05:00 to 2:07:30 | 350 | 0.2% |
| 2:07:30 to 2:10:00 | 305 | 0.2% |
| 2:10:00 to 2:12:30 | 275 | 0.1% |
| 2:12:30 to 2:15:00 | 185 | 0.1% |
| 2:15:00 to 2:17:30 | 151 | 0.1% |
| 2:17:30 to 2:20:00 | 160 | 0.1% |
| 2:20:00 to 2:22:30 | 110 | 0.1% |
| 2:22:30 to 2:25:00 | 93 | 0.0% |
| 2:25:00 to 2:27:30 | 66 | 0.0% |
| 2:27:30 to 2:30:00 | 58 | 0.0% |
| 2:30:00 to 2:32:30 | 67 | 0.0% |
| 2:32:30 to 2:35:00 | 51 | 0.0% |
| 2:35:00 to 2:37:30 | 30 | 0.0% |
| 2:37:30 to 2:40:00 | 18 | 0.0% |
| 2:40:00 to 2:42:30 | 27 | 0.0% |
| 2:42:30 to 2:45:00 | 27 | 0.0% |
| 2:45:00 to 2:47:30 | 20 | 0.0% |
| 2:47:30 to 2:50:00 | 21 | 0.0% |
| 2:50:00 to 2:52:30 | 10 | 0.0% |
| 2:52:30 to 2:55:00 | 13 | 0.0% |
| 2:55:00 to 2:57:30 | 6 | 0.0% |
| 2:57:30 to 3:00:00 | 9 | 0.0% |
| 3:00:00 to 3:02:30 | 6 | 0.0% |
| 3:02:30 to 3:05:00 | 3 | 0.0% |
| 3:05:00 to 3:07:30 | 4 | 0.0% |
| 3:07:30 to 3:10:00 | 3 | 0.0% |
| 3:10:00 to 3:12:30 | 3 | 0.0% |
| 3:12:30 to 3:15:00 | 3 | 0.0% |
| 3:15:00 to 3:17:30 | 1 | 0.0% |
| 3:17:30 to 3:20:00 | 8 | 0.0% |
This chart shows how many athletes finished in each 2.5-minute band, fastest on the left.A field of normal spread: typical 1:28:04, middle half about 1:20:14 to 1:38:09, fastest 10% (green) under 1:14:16.The marked line is fastest 25%: 1:20:14. The busiest band was 1:22:30 to 1:25:00.
See the numbers
| Time band | How many | Share |
|---|---|---|
| 52:30 to 55:00 | 2 | 0.0% |
| 55:00 to 57:30 | 19 | 0.0% |
| 57:30 to 1:00:00 | 88 | 0.0% |
| 1:00:00 to 1:02:30 | 313 | 0.2% |
| 1:02:30 to 1:05:00 | 895 | 0.5% |
| 1:05:00 to 1:07:30 | 2,134 | 1.1% |
| 1:07:30 to 1:10:00 | 3,983 | 2.0% |
| 1:10:00 to 1:12:30 | 6,170 | 3.2% |
| 1:12:30 to 1:15:00 | 8,820 | 4.5% |
| 1:15:00 to 1:17:30 | 11,430 | 5.8% |
| 1:17:30 to 1:20:00 | 13,618 | 7.0% |
| 1:20:00 to 1:22:30 | 15,396 | 7.9% |
| 1:22:30 to 1:25:00 | 15,769 | 8.1% |
| 1:25:00 to 1:27:30 | 15,620 | 8.0% |
| 1:27:30 to 1:30:00 | 15,012 | 7.7% |
| 1:30:00 to 1:32:30 | 13,319 | 6.8% |
| 1:32:30 to 1:35:00 | 11,685 | 6.0% |
| 1:35:00 to 1:37:30 | 10,174 | 5.2% |
| 1:37:30 to 1:40:00 | 8,853 | 4.5% |
| 1:40:00 to 1:42:30 | 7,353 | 3.8% |
| 1:42:30 to 1:45:00 | 6,190 | 3.2% |
| 1:45:00 to 1:47:30 | 5,094 | 2.6% |
| 1:47:30 to 1:50:00 | 4,408 | 2.3% |
| 1:50:00 to 1:52:30 | 3,512 | 1.8% |
| 1:52:30 to 1:55:00 | 2,956 | 1.5% |
| 1:55:00 to 1:57:30 | 2,404 | 1.2% |
| 1:57:30 to 2:00:00 | 1,928 | 1.0% |
| 2:00:00 to 2:02:30 | 1,538 | 0.8% |
| 2:02:30 to 2:05:00 | 1,258 | 0.6% |
| 2:05:00 to 2:07:30 | 1,050 | 0.5% |
| 2:07:30 to 2:10:00 | 846 | 0.4% |
| 2:10:00 to 2:12:30 | 678 | 0.3% |
| 2:12:30 to 2:15:00 | 567 | 0.3% |
| 2:15:00 to 2:17:30 | 451 | 0.2% |
| 2:17:30 to 2:20:00 | 384 | 0.2% |
| 2:20:00 to 2:22:30 | 330 | 0.2% |
| 2:22:30 to 2:25:00 | 247 | 0.1% |
| 2:25:00 to 2:27:30 | 214 | 0.1% |
| 2:27:30 to 2:30:00 | 182 | 0.1% |
| 2:30:00 to 2:32:30 | 141 | 0.1% |
| 2:32:30 to 2:35:00 | 107 | 0.1% |
| 2:35:00 to 2:37:30 | 99 | 0.1% |
| 2:37:30 to 2:40:00 | 78 | 0.0% |
| 2:40:00 to 2:42:30 | 69 | 0.0% |
| 2:42:30 to 2:45:00 | 41 | 0.0% |
| 2:45:00 to 2:47:30 | 41 | 0.0% |
| 2:47:30 to 2:50:00 | 31 | 0.0% |
| 2:50:00 to 2:52:30 | 28 | 0.0% |
| 2:52:30 to 2:55:00 | 23 | 0.0% |
| 2:55:00 to 2:57:30 | 17 | 0.0% |
| 2:57:30 to 3:00:00 | 16 | 0.0% |
| 3:00:00 to 3:02:30 | 15 | 0.0% |
| 3:02:30 to 3:05:00 | 13 | 0.0% |
| 3:05:00 to 3:07:30 | 5 | 0.0% |
| 3:07:30 to 3:10:00 | 7 | 0.0% |
| 3:10:00 to 3:12:30 | 6 | 0.0% |
| 3:12:30 to 3:15:00 | 6 | 0.0% |
| 3:15:00 to 3:17:30 | 4 | 0.0% |
| 3:17:30 to 3:20:00 | 36 | 0.0% |
This chart shows how many athletes finished in each 2.5-minute band, fastest on the left.A field of normal spread: typical 1:22:52, middle half about 1:14:39 to 1:33:16, fastest 10% (green) under 1:08:10.The marked line is fastest 25%: 1:14:38. The busiest band was 1:17:30 to 1:20:00.
See the numbers
| Time band | How many | Share |
|---|---|---|
| 47:30 to 50:00 | 5 | 0.0% |
| 50:00 to 52:30 | 21 | 0.0% |
| 52:30 to 55:00 | 199 | 0.1% |
| 55:00 to 57:30 | 884 | 0.4% |
| 57:30 to 1:00:00 | 2,062 | 1.0% |
| 1:00:00 to 1:02:30 | 3,143 | 1.5% |
| 1:02:30 to 1:05:00 | 4,911 | 2.4% |
| 1:05:00 to 1:07:30 | 6,991 | 3.4% |
| 1:07:30 to 1:10:00 | 9,629 | 4.7% |
| 1:10:00 to 1:12:30 | 11,609 | 5.7% |
| 1:12:30 to 1:15:00 | 13,808 | 6.7% |
| 1:15:00 to 1:17:30 | 15,285 | 7.5% |
| 1:17:30 to 1:20:00 | 16,187 | 7.9% |
| 1:20:00 to 1:22:30 | 15,517 | 7.6% |
| 1:22:30 to 1:25:00 | 14,890 | 7.3% |
| 1:25:00 to 1:27:30 | 13,571 | 6.6% |
| 1:27:30 to 1:30:00 | 12,235 | 6.0% |
| 1:30:00 to 1:32:30 | 10,193 | 5.0% |
| 1:32:30 to 1:35:00 | 8,768 | 4.3% |
| 1:35:00 to 1:37:30 | 7,412 | 3.6% |
| 1:37:30 to 1:40:00 | 6,404 | 3.1% |
| 1:40:00 to 1:42:30 | 5,254 | 2.6% |
| 1:42:30 to 1:45:00 | 4,358 | 2.1% |
| 1:45:00 to 1:47:30 | 3,713 | 1.8% |
| 1:47:30 to 1:50:00 | 3,031 | 1.5% |
| 1:50:00 to 1:52:30 | 2,645 | 1.3% |
| 1:52:30 to 1:55:00 | 2,077 | 1.0% |
| 1:55:00 to 1:57:30 | 1,820 | 0.9% |
| 1:57:30 to 2:00:00 | 1,481 | 0.7% |
| 2:00:00 to 2:02:30 | 1,112 | 0.5% |
| 2:02:30 to 2:05:00 | 944 | 0.5% |
| 2:05:00 to 2:07:30 | 825 | 0.4% |
| 2:07:30 to 2:10:00 | 703 | 0.3% |
| 2:10:00 to 2:12:30 | 567 | 0.3% |
| 2:12:30 to 2:15:00 | 445 | 0.2% |
| 2:15:00 to 2:17:30 | 375 | 0.2% |
| 2:17:30 to 2:20:00 | 328 | 0.2% |
| 2:20:00 to 2:22:30 | 243 | 0.1% |
| 2:22:30 to 2:25:00 | 261 | 0.1% |
| 2:25:00 to 2:27:30 | 190 | 0.1% |
| 2:27:30 to 2:30:00 | 161 | 0.1% |
| 2:30:00 to 2:32:30 | 131 | 0.1% |
| 2:32:30 to 2:35:00 | 110 | 0.1% |
| 2:35:00 to 2:37:30 | 85 | 0.0% |
| 2:37:30 to 2:40:00 | 88 | 0.0% |
| 2:40:00 to 2:42:30 | 75 | 0.0% |
| 2:42:30 to 2:45:00 | 52 | 0.0% |
| 2:45:00 to 2:47:30 | 38 | 0.0% |
| 2:47:30 to 2:50:00 | 46 | 0.0% |
| 2:50:00 to 2:52:30 | 38 | 0.0% |
| 2:52:30 to 2:55:00 | 30 | 0.0% |
| 2:55:00 to 2:57:30 | 32 | 0.0% |
| 2:57:30 to 3:00:00 | 16 | 0.0% |
| 3:00:00 to 3:02:30 | 20 | 0.0% |
| 3:02:30 to 3:05:00 | 17 | 0.0% |
| 3:05:00 to 3:07:30 | 15 | 0.0% |
| 3:07:30 to 3:10:00 | 14 | 0.0% |
| 3:10:00 to 3:12:30 | 8 | 0.0% |
| 3:12:30 to 3:15:00 | 12 | 0.0% |
| 3:15:00 to 3:17:30 | 3 | 0.0% |
| 3:17:30 to 3:20:00 | 50 | 0.0% |
This chart shows how many athletes finished in each 2.5-minute band, fastest on the left.A widely spread field with a long slow tail: typical 1:21:01, middle half about 1:11:47 to 1:33:02, fastest 10% (green) under 1:05:29.The marked line is fastest 25%: 1:11:48. The busiest band was 1:17:30 to 1:20:00.
See the numbers
| Time band | How many | Share |
|---|---|---|
| 52:30 to 55:00 | 51 | 0.1% |
| 55:00 to 57:30 | 424 | 0.7% |
| 57:30 to 1:00:00 | 975 | 1.6% |
| 1:00:00 to 1:02:30 | 1,584 | 2.7% |
| 1:02:30 to 1:05:00 | 2,383 | 4.0% |
| 1:05:00 to 1:07:30 | 3,043 | 5.1% |
| 1:07:30 to 1:10:00 | 3,757 | 6.3% |
| 1:10:00 to 1:12:30 | 3,703 | 6.2% |
| 1:12:30 to 1:15:00 | 4,064 | 6.8% |
| 1:15:00 to 1:17:30 | 4,031 | 6.8% |
| 1:17:30 to 1:20:00 | 4,113 | 6.9% |
| 1:20:00 to 1:22:30 | 3,797 | 6.4% |
| 1:22:30 to 1:25:00 | 3,582 | 6.0% |
| 1:25:00 to 1:27:30 | 3,215 | 5.4% |
| 1:27:30 to 1:30:00 | 2,911 | 4.9% |
| 1:30:00 to 1:32:30 | 2,480 | 4.2% |
| 1:32:30 to 1:35:00 | 2,199 | 3.7% |
| 1:35:00 to 1:37:30 | 1,862 | 3.1% |
| 1:37:30 to 1:40:00 | 1,692 | 2.8% |
| 1:40:00 to 1:42:30 | 1,356 | 2.3% |
| 1:42:30 to 1:45:00 | 1,160 | 2.0% |
| 1:45:00 to 1:47:30 | 974 | 1.6% |
| 1:47:30 to 1:50:00 | 914 | 1.5% |
| 1:50:00 to 1:52:30 | 747 | 1.3% |
| 1:52:30 to 1:55:00 | 652 | 1.1% |
| 1:55:00 to 1:57:30 | 560 | 0.9% |
| 1:57:30 to 2:00:00 | 446 | 0.8% |
| 2:00:00 to 2:02:30 | 372 | 0.6% |
| 2:02:30 to 2:05:00 | 327 | 0.6% |
| 2:05:00 to 2:07:30 | 268 | 0.5% |
| 2:07:30 to 2:10:00 | 239 | 0.4% |
| 2:10:00 to 2:12:30 | 190 | 0.3% |
| 2:12:30 to 2:15:00 | 175 | 0.3% |
| 2:15:00 to 2:17:30 | 130 | 0.2% |
| 2:17:30 to 2:20:00 | 134 | 0.2% |
| 2:20:00 to 2:22:30 | 115 | 0.2% |
| 2:22:30 to 2:25:00 | 99 | 0.2% |
| 2:25:00 to 2:27:30 | 76 | 0.1% |
| 2:27:30 to 2:30:00 | 90 | 0.2% |
| 2:30:00 to 2:32:30 | 69 | 0.1% |
| 2:32:30 to 2:35:00 | 55 | 0.1% |
| 2:35:00 to 2:37:30 | 49 | 0.1% |
| 2:37:30 to 2:40:00 | 43 | 0.1% |
| 2:40:00 to 2:42:30 | 37 | 0.1% |
| 2:42:30 to 2:45:00 | 34 | 0.1% |
| 2:45:00 to 2:47:30 | 39 | 0.1% |
| 2:47:30 to 2:50:00 | 27 | 0.0% |
| 2:50:00 to 2:52:30 | 23 | 0.0% |
| 2:52:30 to 2:55:00 | 22 | 0.0% |
| 2:55:00 to 2:57:30 | 16 | 0.0% |
| 2:57:30 to 3:00:00 | 16 | 0.0% |
| 3:00:00 to 3:02:30 | 17 | 0.0% |
| 3:02:30 to 3:05:00 | 13 | 0.0% |
| 3:05:00 to 3:07:30 | 12 | 0.0% |
| 3:07:30 to 3:10:00 | 10 | 0.0% |
| 3:10:00 to 3:12:30 | 9 | 0.0% |
| 3:12:30 to 3:15:00 | 7 | 0.0% |
| 3:15:00 to 3:17:30 | 8 | 0.0% |
| 3:17:30 to 3:20:00 | 49 | 0.1% |
This chart shows how many athletes finished in each 2.5-minute band, fastest on the left.A field of normal spread with a long slow tail: typical 1:26:42, middle half about 1:17:12 to 1:38:50, fastest 10% (green) under 1:10:40.The marked line is fastest 25%: 1:17:13. The busiest band was 1:20:00 to 1:22:30.
See the numbers
| Time band | How many | Share |
|---|---|---|
| 55:00 to 57:30 | 5 | 0.0% |
| 57:30 to 1:00:00 | 51 | 0.2% |
| 1:00:00 to 1:02:30 | 185 | 0.7% |
| 1:02:30 to 1:05:00 | 411 | 1.5% |
| 1:05:00 to 1:07:30 | 654 | 2.4% |
| 1:07:30 to 1:10:00 | 1,067 | 3.9% |
| 1:10:00 to 1:12:30 | 1,331 | 4.9% |
| 1:12:30 to 1:15:00 | 1,601 | 5.9% |
| 1:15:00 to 1:17:30 | 1,643 | 6.1% |
| 1:17:30 to 1:20:00 | 1,739 | 6.4% |
| 1:20:00 to 1:22:30 | 1,831 | 6.8% |
| 1:22:30 to 1:25:00 | 1,798 | 6.7% |
| 1:25:00 to 1:27:30 | 1,733 | 6.4% |
| 1:27:30 to 1:30:00 | 1,664 | 6.2% |
| 1:30:00 to 1:32:30 | 1,467 | 5.4% |
| 1:32:30 to 1:35:00 | 1,334 | 4.9% |
| 1:35:00 to 1:37:30 | 1,171 | 4.3% |
| 1:37:30 to 1:40:00 | 1,086 | 4.0% |
| 1:40:00 to 1:42:30 | 819 | 3.0% |
| 1:42:30 to 1:45:00 | 773 | 2.9% |
| 1:45:00 to 1:47:30 | 583 | 2.2% |
| 1:47:30 to 1:50:00 | 578 | 2.1% |
| 1:50:00 to 1:52:30 | 494 | 1.8% |
| 1:52:30 to 1:55:00 | 395 | 1.5% |
| 1:55:00 to 1:57:30 | 382 | 1.4% |
| 1:57:30 to 2:00:00 | 307 | 1.1% |
| 2:00:00 to 2:02:30 | 242 | 0.9% |
| 2:02:30 to 2:05:00 | 197 | 0.7% |
| 2:05:00 to 2:07:30 | 177 | 0.7% |
| 2:07:30 to 2:10:00 | 155 | 0.6% |
| 2:10:00 to 2:12:30 | 135 | 0.5% |
| 2:12:30 to 2:15:00 | 124 | 0.5% |
| 2:15:00 to 2:17:30 | 99 | 0.4% |
| 2:17:30 to 2:20:00 | 97 | 0.4% |
| 2:20:00 to 2:22:30 | 88 | 0.3% |
| 2:22:30 to 2:25:00 | 81 | 0.3% |
| 2:25:00 to 2:27:30 | 65 | 0.2% |
| 2:27:30 to 2:30:00 | 59 | 0.2% |
| 2:30:00 to 2:32:30 | 41 | 0.2% |
| 2:32:30 to 2:35:00 | 42 | 0.2% |
| 2:35:00 to 2:37:30 | 26 | 0.1% |
| 2:37:30 to 2:40:00 | 32 | 0.1% |
| 2:40:00 to 2:42:30 | 27 | 0.1% |
| 2:42:30 to 2:45:00 | 33 | 0.1% |
| 2:45:00 to 2:47:30 | 18 | 0.1% |
| 2:47:30 to 2:50:00 | 14 | 0.1% |
| 2:50:00 to 2:52:30 | 13 | 0.0% |
| 2:52:30 to 2:55:00 | 16 | 0.1% |
| 2:55:00 to 2:57:30 | 14 | 0.1% |
| 2:57:30 to 3:00:00 | 17 | 0.1% |
| 3:00:00 to 3:02:30 | 8 | 0.0% |
| 3:02:30 to 3:05:00 | 8 | 0.0% |
| 3:05:00 to 3:07:30 | 12 | 0.0% |
| 3:07:30 to 3:10:00 | 8 | 0.0% |
| 3:10:00 to 3:12:30 | 6 | 0.0% |
| 3:12:30 to 3:15:00 | 8 | 0.0% |
| 3:15:00 to 3:17:30 | 5 | 0.0% |
| 3:17:30 to 3:20:00 | 49 | 0.2% |
Course notes
- The first HYROX in Tampa, so there is no course data yet. The analysis goes up the week after the race.
Before you go
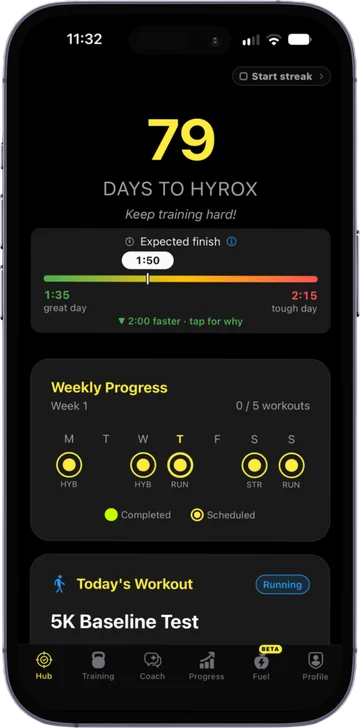
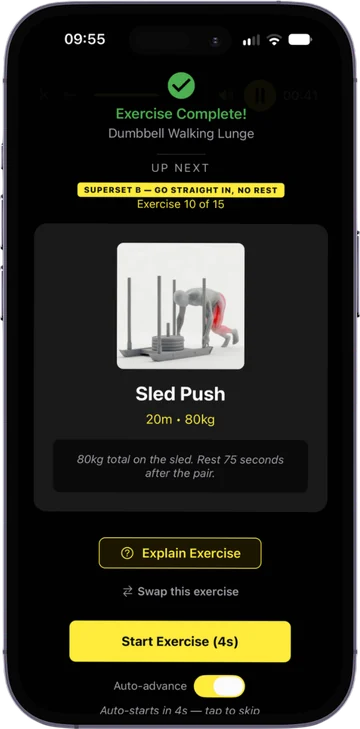
Raced Tampa? Train for your next race and beat this time.
The RoxHype app is your training plan to race day: built from your splits, your kit and your race date, and adjusted every week.
- A week-by-week plan that counts down to your race
- Extra work on your slowest stations
- Adjusts every week to what you actually did
Free to download. Used by more than 40,000 HYROX athletes.