 GER
Kristina Schreiber
5 HYROX races over 2 seasons: 2 solo, 3 in a team with 1 partner.
One best per race type
Finish time, race by race: one race type at a time
Oldest to newest; a line going down means getting fasterThis line shows the finish time of Kristina Schreiber at each race, oldest on the left; lower is faster.The best was 1:23:44 at dusseldorf (Nov 2026); Kristina Schreiber was 4:49 faster at the latest race than at the first.
See the numbers
| Race | Date | Division | Finish |
|---|---|---|---|
| Maastricht | Sep 2026 | Open Women | 1:28:33 |
| dusseldorf | Nov 2026 | Open Women | 1:23:44 |
Each dot is one Open Women race; click one for that race's report. Not enough complete, clean Open Women races yet to measure the change.
This line shows the finish time of Kristina Schreiber at each race, oldest on the left; lower is faster.The best was 1:18:57 at Berlin (May 2026); Kristina Schreiber was 10:39 faster at the latest race than at the first.
See the numbers
| Race | Date | Division | Finish |
|---|---|---|---|
| Stuttgart | Nov 2025 | Doubles Mixed | 1:29:36 |
| Mechelen | Mar 2026 | Doubles Mixed | 1:20:03 |
| Berlin | May 2026 | Doubles Mixed | 1:18:57 |
Each dot is one Doubles Mixed race; click one for that race's report. Not enough complete, clean Doubles Mixed races yet to measure the change. Team times are shared with a partner, so they move with who you race with.
5 results at 5 races

317th of 1,072 Open Women (faster than 70%). Against the 32 who finished around 1:28:41: most time gained on sandbag lunges (0:42), most lost on the eight runs (1:28). Runs 5 to 8 took 0:21 more than runs 1 to 4 (them: 2:05 more).
| Part | Time | Typical here | vs 1,072 Open Women here |
|---|---|---|---|
| Run 1: | 4:24 | 4:18 | faster than 43% |
| SkiErg: | 4:53 | 5:09 | faster than 81% |
| Run 2: | 5:45 | 5:38 | faster than 43% |
| Sled push: | 2:56 | 2:57 | faster than 51% |
| Run 3: | 5:58 | 5:58 | faster than 50% |
| Sled pull: | 4:19 | 5:22 | faster than 87% |
| Run 4: | 6:01 | 6:00 | faster than 48% |
| Burpee broad jump: | 6:43 | 7:01 | faster than 57% |
| Run 5: | 5:46 | 6:03 | faster than 62% |
| Row: | 5:02 | 5:30 | faster than 91% |
| Run 6: | 5:29 | 5:57 | faster than 72% |
| Farmers carry: | 2:16 | 2:23 | faster than 60% |
| Run 7: | 5:24 | 5:57 | faster than 75% |
| Sandbag lunges: | 3:57 | 5:07 | faster than 87% |
| Run 8: | 5:50 | 6:31 | faster than 76% |
| Wall balls: | 5:58 | 6:42 | faster than 65% |
| Roxzone: | 8:04 | 8:26 | faster than 59% |
| Runs (8 km) | 44:32 | 46:29 | faster than 61% |
| Stations (8) | 36:04 | ||
| Finish | 1:28:33 | 1:35:36 | 317th of 1,072 · faster than 70% |

1,546th of 3,620 Doubles Mixed (faster than 57%). Against the 112 who finished around 1:19:31: most time gained on sandbag lunges (0:36), most lost on SkiErg (0:14). Runs 5 to 8 took 2:44 more than runs 1 to 4 (them: 2:53 more).
| Part | Time | Typical here | vs 3,620 Doubles Mixed here |
|---|---|---|---|
| Run 1: | 4:17 | 3:55 | faster than 25% |
| SkiErg: | 4:31 | 4:18 | faster than 22% |
| Run 2: | 4:11 | 4:13 | faster than 52% |
| Sled push: | 2:29 | 2:18 | faster than 34% |
| Run 3: | 4:10 | 4:23 | faster than 65% |
| Sled pull: | 3:32 | 3:30 | faster than 48% |
| Run 4: | 4:17 | 4:28 | faster than 61% |
| Burpee broad jump: | 3:27 | 3:38 | faster than 59% |
| Run 5: | 4:25 | 4:34 | faster than 58% |
| Row: | 4:46 | 4:43 | faster than 46% |
| Run 6: | 4:26 | 4:33 | faster than 57% |
| Farmers carry: | 1:52 | 1:52 | faster than 50% |
| Run 7: | 4:34 | 4:36 | faster than 52% |
| Sandbag lunges: | 3:27 | 4:04 | faster than 77% |
| Run 8: | 6:14 | 6:23 | faster than 55% |
| Wall balls: | 3:58 | 4:32 | faster than 81% |
| Roxzone: | — | ||
| Runs (8 km) | 36:29 | 37:09 | faster than 54% |
| Stations (8) | 28:02 | ||
| Finish | 1:18:57 | 1:21:01 | 1546th of 3,620 · faster than 57% |

932nd of 1,780 Doubles Mixed (faster than 47%). Against the 54 who finished around 1:19:22: most time gained on sandbag lunges (0:43), most lost on the roxzone (0:59). Runs 5 to 8 took 1:56 more than runs 1 to 4 (them: 2:00 more).
| Part | Time | Typical here | vs 1,780 Doubles Mixed here |
|---|---|---|---|
| Run 1: | 4:21 | 4:12 | faster than 41% |
| SkiErg: | 4:22 | 4:15 | faster than 33% |
| Run 2: | 5:10 | 5:10 | faster than 49% |
| Sled push: | 2:21 | 1:58 | faster than 15% |
| Run 3: | 5:41 | 5:24 | faster than 37% |
| Sled pull: | 3:31 | 3:34 | faster than 54% |
| Run 4: | 5:35 | 5:26 | faster than 42% |
| Burpee broad jump: | 3:20 | 3:42 | faster than 66% |
| Run 5: | 5:43 | 5:33 | faster than 42% |
| Row: | 5:02 | 4:40 | faster than 19% |
| Run 6: | 5:24 | 5:30 | faster than 54% |
| Farmers carry: | 1:36 | 1:48 | faster than 80% |
| Run 7: | 5:26 | 5:27 | faster than 51% |
| Sandbag lunges: | 3:18 | 3:57 | faster than 78% |
| Run 8: | 6:10 | 5:52 | faster than 38% |
| Wall balls: | 4:12 | 4:30 | faster than 65% |
| Roxzone: | 8:59 | 8:03 | faster than 29% |
| Runs (8 km) | 43:25 | 42:36 | faster than 45% |
| Stations (8) | 27:42 | ||
| Finish | 1:20:03 | 1:19:26 | 932nd of 1,780 · faster than 47% |

671st of 858 Doubles Mixed (faster than 21%).
| Part | Time | Typical here | vs 858 Doubles Mixed here |
|---|---|---|---|
| Run 1: | 5:30 | 5:23 | faster than 45% |
| SkiErg: | 4:54 | 4:16 | faster than 2% |
| Run 2: | 4:48 | 4:48 | faster than 49% |
| Sled push: | 2:10 | 2:01 | faster than 34% |
| Run 3: | 5:27 | 5:06 | faster than 34% |
| Sled pull: | 4:24 | 3:48 | faster than 21% |
| Run 4: | 5:45 | 5:06 | faster than 23% |
| Burpee broad jump: | 4:52 | 3:28 | faster than 8% |
| Run 5: | 5:48 | 5:12 | faster than 25% |
| Row: | 5:21 | 4:39 | faster than 4% |
| Run 6: | 5:51 | 5:08 | faster than 21% |
| Farmers carry: | 1:49 | 1:45 | faster than 42% |
| Run 7: | 5:37 | 5:08 | faster than 28% |
| Sandbag lunges: | 4:00 | 3:52 | faster than 43% |
| Run 8: | 6:07 | 5:25 | faster than 25% |
| Wall balls: | 5:01 | 4:39 | faster than 34% |
| Roxzone: | 12:20 | 9:28 | faster than 12% |
| Runs (8 km) | 44:49 | 41:24 | faster than 30% |
| Stations (8) | 32:31 | ||
| Finish | 1:29:36 | 1:19:45 | 671st of 858 · faster than 21% |
How to read
Place is the position among timed finishers in the same race, division and gender; a doubles place is the team's. Runs is the organiser's official run total (it can differ from the eight laps added up by a few seconds), stations the eight stations added up, and roxzone the time moving between them. A dash in runs, stations and roxzone on a result from the live results service means the splits are not in yet (finish time only). The age group is the one entered for that race; for a team it is the team’s age group. A dash means the organiser did not publish that number for the result. * At that edition running was under 44% of the typical finish (48% is normal): the timing mats counted some running as station time, so its runs look faster and its stations slower than they were.
1 team partner
- Tobias Schreiber3 races
From the team results above. A name opens the search: a partner can have more than one page.
Maastricht 2026, against 1,072 Open Women
Shape of the race
This chart shows where Kristina sat in the field on each part of the race: the edge is faster than everyone, the centre is the slowest.Strongest on Row (faster than 91% of the field), weakest on Push (faster than 52%).
See the numbers
| Part | Kristina: faster than |
|---|---|
| Ski | 81% |
| Push | 52% |
| Pull | 87% |
| BBJ | 58% |
| Row | 91% |
| Carry | 61% |
| Lunges | 88% |
| Wall balls | 66% |
| Roxzone | 59% |
| Runs | 61% |
Further out means you beat more of the field on that part. A dent is a weak spot.
How you ranked on each station
How much of the field Kristina beat on each part of the race, at this race.Best: Row (faster than 91%); weakest: Sled push (faster than 52%).
Longer is better: the share of the field you beat.
Minutes against the typical finisher
Kristina's time on each part against the typical Open Women finisher at this race.Best: Runs (8 km) (1:57 faster); weakest: Sled push (0:01 faster).
Green, left of centre: faster than the typical Open Women finisher at this race. Orange, right: slower, and by how much.
The race as one bar: Kristina against the typical Open Women finisher
This chart draws the race in order, left to right: each 1 km run (blue), each station (yellow) and the roxzone (grey), sized by its time.Kristina: 44:37 running, 36:04 at the stations and 8:04 in the roxzone; the longest station was the burpee broad jumps (6:43).Below, Typical Open Women: 46:22 running, 40:11 at the stations and 8:26 in the roxzone; the longest station was the burpee broad jumps (7:01).
See the numbers
| Part | Kristina | Typical Open Women |
|---|---|---|
| Run 1 | 4:24 | 4:18 |
| SkiErg | 4:53 | 5:09 |
| Run 2 | 5:45 | 5:38 |
| Sled push | 2:56 | 2:57 |
| Run 3 | 5:58 | 5:58 |
| Sled pull | 4:19 | 5:22 |
| Run 4 | 6:01 | 6:00 |
| Burpee broad jump | 6:43 | 7:01 |
| Run 5 | 5:46 | 6:03 |
| Row | 5:02 | 5:30 |
| Run 6 | 5:29 | 5:57 |
| Farmers carry | 2:16 | 2:23 |
| Run 7 | 5:24 | 5:57 |
| Sandbag lunges | 3:57 | 5:07 |
| Run 8 | 5:50 | 6:31 |
| Wall balls | 5:58 | 6:42 |
| Roxzone | 8:04 | 8:26 |
| Finish | 1:28:33 | 1:35:36 |
The race in order, left to right. A wider block than the one below is slower than typical.
Training for the next one? Let's beat 1:23:44.
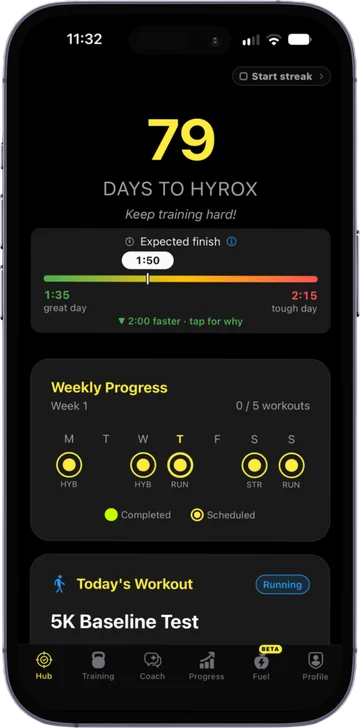
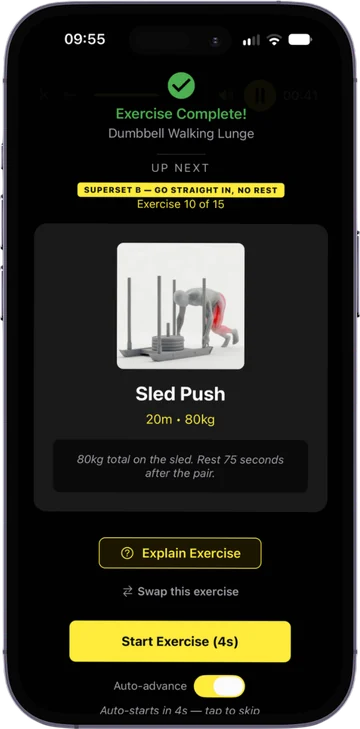
The RoxHype app is your training plan to race day: built from your splits, your kit and your race date, and adjusted every week.
- A week-by-week plan that counts down to your race
- Extra work on your slowest stations
- Adjusts every week to what you actually did
Free to download. Used by more than 40,000 HYROX athletes.