 USA
Natalie Wahlers
3 HYROX races over 2 seasons: 1 solo, 2 in a team with 1 partner.
One best per race type
Doubles Women: finish time, race by race
Oldest to newest; a line going down means getting fasterThis line shows the finish time of Natalie Wahlers at each race, oldest on the left; lower is faster.The best was 1:23:19 at Boston (Oct 2026); Natalie Wahlers was 1:50 faster at the latest race than at the first.
See the numbers
| Race | Date | Division | Finish |
|---|---|---|---|
| Las Vegas | Feb 2026 | Doubles Women | 1:25:09 |
| Boston | Oct 2026 | Doubles Women | 1:23:19 |
Each dot is one Doubles Women race; click one for that race's report. Not enough complete, clean Doubles Women races yet to measure the change. Team times are shared with a partner, so they move with who you race with.
3 results at 2 races

161st of 1,649 Open Women (faster than 90%). Against the 50 who finished around 1:20:24: most time gained on row (0:21), most lost on burpee broad jump (1:03). Runs 5 to 8 took 1:58 more than runs 1 to 4 (them: 2:04 more).
| Part | Time | Typical here | vs 1,649 Open Women here |
|---|---|---|---|
| Run 1: | 3:50 | 4:45 | faster than 92% |
| SkiErg: | 4:49 | 5:20 | faster than 92% |
| Run 2: | 4:51 | 5:49 | faster than 87% |
| Sled push: | 2:45 | 3:29 | faster than 85% |
| Run 3: | 5:09 | 6:10 | faster than 86% |
| Sled pull: | 5:05 | 6:05 | faster than 80% |
| Run 4: | 5:05 | 6:08 | faster than 87% |
| Burpee broad jump: | 6:23 | 7:07 | faster than 63% |
| Run 5: | 5:10 | 6:20 | faster than 88% |
| Row: | 4:51 | 5:37 | faster than 97% |
| Run 6: | 5:05 | 6:12 | faster than 88% |
| Farmers carry: | 1:57 | 2:21 | faster than 88% |
| Run 7: | 5:00 | 6:08 | faster than 89% |
| Sandbag lunges: | 4:15 | 5:29 | faster than 84% |
| Run 8: | 5:38 | 7:06 | faster than 90% |
| Wall balls: | 4:56 | 6:43 | faster than 87% |
| Roxzone: | 5:37 | 7:34 | faster than 87% |
| Runs (8 km) | 39:45 | 48:51 | faster than 90% |
| Stations (8) | 35:01 | ||
| Finish | 1:20:18 | 1:39:21 | 161st of 1,649 · faster than 90% |
529th of 1,860 Doubles Women (faster than 71%). Against the 59 who finished around 1:23:58: most time gained on burpee broad jump (0:27), most lost on the eight runs (1:43). Runs 5 to 8 took 2:29 more than runs 1 to 4 (them: 2:14 more).
| Part | Time | Typical here | vs 1,860 Doubles Women here |
|---|---|---|---|
| Run 1: | 4:42 | 5:09 | faster than 72% |
| SkiErg: | 4:48 | 4:53 | faster than 60% |
| Run 2: | 5:54 | 6:08 | faster than 60% |
| Sled push: | 1:51 | 2:14 | faster than 88% |
| Run 3: | 6:10 | 6:28 | faster than 61% |
| Sled pull: | 4:08 | 4:38 | faster than 75% |
| Run 4: | 6:16 | 6:28 | faster than 57% |
| Burpee broad jump: | 3:44 | 4:34 | faster than 80% |
| Run 5: | 6:14 | 6:35 | faster than 62% |
| Row: | 4:50 | 5:14 | faster than 87% |
| Run 6: | 6:16 | 6:31 | faster than 59% |
| Farmers carry: | 1:42 | 1:58 | faster than 85% |
| Run 7: | 6:12 | 6:29 | faster than 60% |
| Sandbag lunges: | 3:08 | 4:00 | faster than 88% |
| Run 8: | 6:49 | 7:14 | faster than 62% |
| Wall balls: | 4:05 | 4:26 | faster than 71% |
| Roxzone: | 6:39 | 7:18 | faster than 63% |
| Runs (8 km) | 48:29 | 51:09 | faster than 63% |
| Stations (8) | 28:16 | ||
| Finish | 1:23:19 | 1:31:05 | 529th of 1,860 · faster than 71% |

552nd of 1,899 Doubles Women (faster than 70%). Against the 57 who finished around 1:25:35: most time gained on sandbag lunges (0:35), most lost on wall balls (1:17). Runs 5 to 8 took 2:05 more than runs 1 to 4 (them: 3:19 more).
| Part | Time | Typical here | vs 1,899 Doubles Women here |
|---|---|---|---|
| Run 1: | 4:07 | 4:16 | faster than 58% |
| SkiErg: | 4:53 | 5:02 | faster than 66% |
| Run 2: | 6:17 | 6:26 | faster than 55% |
| Sled push: | 1:42 | 2:03 | faster than 89% |
| Run 3: | 6:16 | 6:42 | faster than 67% |
| Sled pull: | 3:41 | 4:16 | faster than 78% |
| Run 4: | 6:28 | 6:47 | faster than 61% |
| Burpee broad jump: | 4:14 | 4:11 | faster than 48% |
| Run 5: | 6:17 | 6:56 | faster than 72% |
| Row: | 4:35 | 5:20 | faster than 98% |
| Run 6: | 6:16 | 6:55 | faster than 72% |
| Farmers carry: | 1:37 | 1:52 | faster than 82% |
| Run 7: | 6:12 | 6:53 | faster than 73% |
| Sandbag lunges: | 2:47 | 3:46 | faster than 93% |
| Run 8: | 6:28 | 7:02 | faster than 67% |
| Wall balls: | 5:38 | 4:37 | faster than 17% |
| Roxzone: | 7:47 | 8:50 | faster than 69% |
| Runs (8 km) | 48:18 | 52:18 | faster than 68% |
| Stations (8) | 29:07 | ||
| Finish | 1:25:09 | 1:32:48 | 552nd of 1,899 · faster than 70% |
How to read
Place is the position among timed finishers in the same race, division and gender; a doubles place is the team's. Runs is the organiser's official run total (it can differ from the eight laps added up by a few seconds), stations the eight stations added up, and roxzone the time moving between them. The age group is the one entered for that race; for a team it is the team’s age group.
1 team partner
- Lauren Rudeen2 races
From the team results above. A name opens the search: a partner can have more than one page.
Boston 2026, against 1,649 Open Women
Shape of the race
This chart shows where Natalie sat in the field on each part of the race: the edge is faster than everyone, the centre is the slowest.Strongest on Row (faster than 98% of the field), weakest on BBJ (faster than 64%).
See the numbers
| Part | Natalie: faster than |
|---|---|
| Ski | 93% |
| Push | 86% |
| Pull | 80% |
| BBJ | 64% |
| Row | 98% |
| Carry | 89% |
| Lunges | 85% |
| Wall balls | 87% |
| Roxzone | 88% |
| Runs | 90% |
Further out means you beat more of the field on that part. A dent is a weak spot.
How you ranked on each station
How much of the field Natalie beat on each part of the race, at this race.Best: Row (faster than 98%); weakest: Burpee broad jump (faster than 64%).
Longer is better: the share of the field you beat.
Minutes against the typical finisher
Natalie's time on each part against the typical Open Women finisher at this race.Best: Runs (8 km) (9:06 faster); weakest: Farmers carry (0:24 faster).
Green, left of centre: faster than the typical Open Women finisher at this race. Orange, right: slower, and by how much.
The race as one bar: Natalie against the typical Open Women finisher
This chart draws the race in order, left to right: each 1 km run (blue), each station (yellow) and the roxzone (grey), sized by its time.Natalie: 39:47 running, 35:01 at the stations and 5:37 in the roxzone; the longest station was the burpee broad jumps (6:23).Below, Typical Open Women: 48:38 running, 42:11 at the stations and 7:34 in the roxzone; the longest station was the burpee broad jumps (7:07).
See the numbers
| Part | Natalie | Typical Open Women |
|---|---|---|
| Run 1 | 3:50 | 4:45 |
| SkiErg | 4:49 | 5:20 |
| Run 2 | 4:51 | 5:49 |
| Sled push | 2:45 | 3:29 |
| Run 3 | 5:09 | 6:10 |
| Sled pull | 5:05 | 6:05 |
| Run 4 | 5:05 | 6:08 |
| Burpee broad jump | 6:23 | 7:07 |
| Run 5 | 5:10 | 6:20 |
| Row | 4:51 | 5:37 |
| Run 6 | 5:05 | 6:12 |
| Farmers carry | 1:57 | 2:21 |
| Run 7 | 5:00 | 6:08 |
| Sandbag lunges | 4:15 | 5:29 |
| Run 8 | 5:38 | 7:06 |
| Wall balls | 4:56 | 6:43 |
| Roxzone | 5:37 | 7:34 |
| Finish | 1:20:18 | 1:39:21 |
The race in order, left to right. A wider block than the one below is slower than typical.
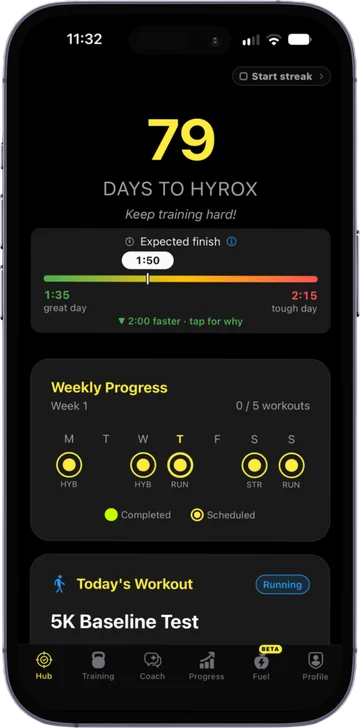
Training for the next one? Let's beat 1:20:18.
The RoxHype app is your training plan to race day: built from your splits, your kit and your race date, and adjusted every week.
- A week-by-week plan that counts down to your race
- Extra work on your slowest stations
- Adjusts every week to what you actually did
Free to download. Used by more than 40,000 HYROX athletes.