 FRA
Erika Cruvelier
1 HYROX race over 1 season. Best Adaptive Women time: 1:39:14 at Nice Nice.
1 result at 1 race

5th of 6 Adaptive Women.
| Part | Time | Typical here | vs 6 Adaptive Women here |
|---|---|---|---|
| Run 1: | 4:47 | ||
| SkiErg: | 4:32 | faster than 75% | |
| Run 2: | 4:44 | ||
| Sled push: | 2:14 | fastest in the field | |
| Run 3: | 4:56 | ||
| Sled pull: | 2:37 | fastest in the field | |
| Run 4: | 4:55 | ||
| Burpee broad jump: | 11:38 | faster than 19% | |
| Run 5: | 5:16 | ||
| Row: | 5:02 | faster than 60% | |
| Run 6: | 5:22 | ||
| Farmers carry: | 2:04 | faster than 50% | |
| Run 7: | 8:14 | ||
| Sandbag lunges: | 6:56 | faster than 25% | |
| Run 8: | 9:44 | ||
| Wall balls: | 6:45 | faster than 66% | |
| Roxzone: | 9:36 | faster than 19% | |
| Runs (8 km) | 47:54 | faster than 19% | |
| Stations (8) | 41:48 | ||
| Finish | 1:39:14 | 1:15:30 | 5th of 6 |
How to read
Place is the position among timed finishers in the same race, division and gender; a doubles place is the team's. Runs is the organiser's official run total (it can differ from the eight laps added up by a few seconds), stations the eight stations added up, and roxzone the time moving between them. The age group is the one entered for that race.
Nice Nice, against 6 Adaptive Women
Shape of the race
This chart shows where Erika sat in the field on each part of the race: the edge is faster than everyone, the centre is the slowest.Strongest on Push (faster than 99% of the field), weakest on BBJ (faster than 20%).
See the numbers
| Part | Erika: faster than |
|---|---|
| Ski | 75% |
| Push | 99% |
| Pull | 99% |
| BBJ | 20% |
| Row | 60% |
| Carry | 50% |
| Lunges | 25% |
| Wall balls | 67% |
| Roxzone | 20% |
| Runs | 20% |
Further out means you beat more of the field on that part. A dent is a weak spot.
How you ranked on each station
How much of the field Erika beat on each part of the race, at this race.Best: Sled push (faster than 99%); weakest: Burpee broad jump (faster than 20%).
Longer is better: the share of the field you beat.
Minutes against the typical finisher
This field was too small to work out typical splits; the place bars still compare against everyone in it.
The race as one bar: Erika against the typical Adaptive Women finisher
This chart draws the race in order, left to right: each 1 km run (blue), each station (yellow) and the roxzone (grey), sized by its time.Erika: 47:58 running, 41:47 at the stations and 9:36 in the roxzone; the longest station was the burpee broad jumps (11:38).
See the numbers
| Part | Erika |
|---|---|
| Run 1 | 4:47 |
| SkiErg | 4:32 |
| Run 2 | 4:44 |
| Sled push | 2:14 |
| Run 3 | 4:56 |
| Sled pull | 2:37 |
| Run 4 | 4:55 |
| Burpee broad jump | 11:38 |
| Run 5 | 5:16 |
| Row | 5:02 |
| Run 6 | 5:22 |
| Farmers carry | 2:04 |
| Run 7 | 8:14 |
| Sandbag lunges | 6:56 |
| Run 8 | 9:44 |
| Wall balls | 6:45 |
| Roxzone | 9:36 |
| Finish | 1:39:14 |
The race in order, left to right. A wider block than the one below is slower than typical.
Training for the next one? Let's beat 1:39:14.
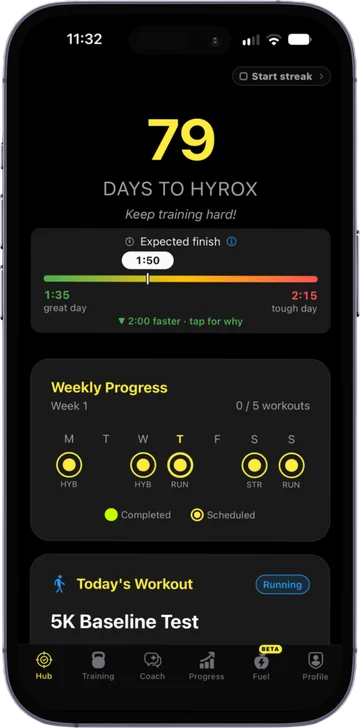
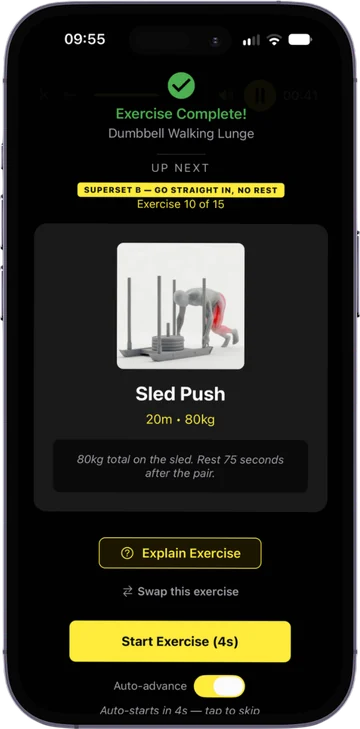
The RoxHype app is your training plan to race day: built from your splits, your kit and your race date, and adjusted every week.
- A week-by-week plan that counts down to your race
- Extra work on your slowest stations
- Adjusts every week to what you actually did
Free to download. Used by more than 40,000 HYROX athletes.