Conor vs Peter
 AUS · Pro Men · 8 results
Conor Hatfield
AUS · Pro Men · 5 results Peter Bujewicz
Station radar · best race with a field of 30 or more
Conor: Brisbane 2024, Pro Men · Peter: Melbourne 2024, Open Men
Not the same division. Conor's race here is Pro Men and Peter's is Open Men, with different weights and fields. The chart shows how each did against their own field, not who is faster.
This chart shows where Conor and Peter sat in the field on each part of the race: the edge is faster than everyone, the centre is the slowest.Conor: strongest on Runs (faster than 93% of the field), weakest on Ski (faster than 16%).Peter: strongest on Pull (faster than 99% of the field), weakest on Wall balls (faster than 39%).
See the numbers
| Part | Conor: faster than | Peter: faster than |
|---|---|---|
| Ski | 16% | 72% |
| Push | 19% | 89% |
| Pull | 36% | 99% |
| BBJ | 92% | 57% |
| Row | 67% | 54% |
| Carry | 56% | 64% |
| Lunges | 57% | 57% |
| Wall balls | 27% | 39% |
| Roxzone | 76% | 88% |
| Runs | 93% | 48% |
Each athlete against their own field at their own best race (division, gender, that venue). Further out is faster.
Part by part
| Part | Conor | Peter |
|---|---|---|
| SkiErg | 16% | 72% |
| Sled push | 19% | 89% |
| Sled pull | 36% | 99% |
| Burpee broad jump | 92% | 57% |
| Row | 67% | 54% |
| Farmers carry | 56% | 64% |
| Sandbag lunges | 57% | 57% |
| Wall balls | 27% | 39% |
| Roxzone (moving) | 76% | 88% |
| Runs (8 km) | 93% | 48% |
The share of their own field each athlete beat on that segment, at the race named on the left. Higher is better; green marks the better of the two. A dash means no split was published.
Those races as one bar each
This chart draws the race in order, left to right: each 1 km run (blue), each station (yellow) and the roxzone (grey), sized by its time.Conor · Brisbane 2024 · Pro Men: 30:41 running, 36:13 at the stations and 4:20 in the roxzone; the longest station was the wall balls (7:39).Below, Peter · Melbourne 2024 · Open Men: 42:08 running, 32:37 at the stations and 6:08 in the roxzone; the longest station was the wall balls (6:40) and the shortest the sled push (1:44).
See the numbers
| Part | Conor · Brisbane 2024 · Pro Men | Peter · Melbourne 2024 · Open Men |
|---|---|---|
| Run 1 | 2:39 | 4:48 |
| SkiErg | 4:25 | 4:12 |
| Run 2 | 3:40 | 4:53 |
| Sled push | 3:40 | 1:44 |
| Run 3 | 3:52 | 5:03 |
| Sled pull | 5:50 | 2:51 |
| Run 4 | 3:47 | 5:16 |
| Burpee broad jump | 3:09 | 5:13 |
| Run 5 | 4:08 | 5:21 |
| Row | 4:19 | 4:47 |
| Run 6 | 4:16 | 5:18 |
| Farmers carry | 2:07 | 2:00 |
| Run 7 | 4:02 | 5:19 |
| Sandbag lunges | 5:03 | 5:10 |
| Run 8 | 4:17 | 6:10 |
| Wall balls | 7:39 | 6:40 |
| Roxzone | 4:20 | 6:08 |
| Finish | 1:11:06 | 1:20:46 |
Head to head: 1 race they both ran
| Race | Conor | Peter | Gap |
|---|---|---|---|
| Sydney 2026 Pro Men · 1 Jul 2026 | 1:21:59 | 1:22:09 | 0:10 · Conor faster |
Close the gap at your next race.
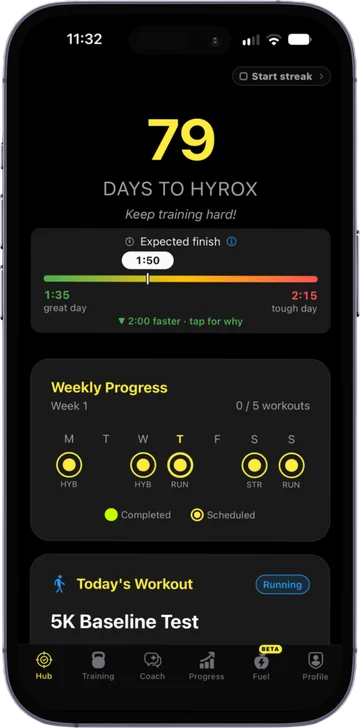
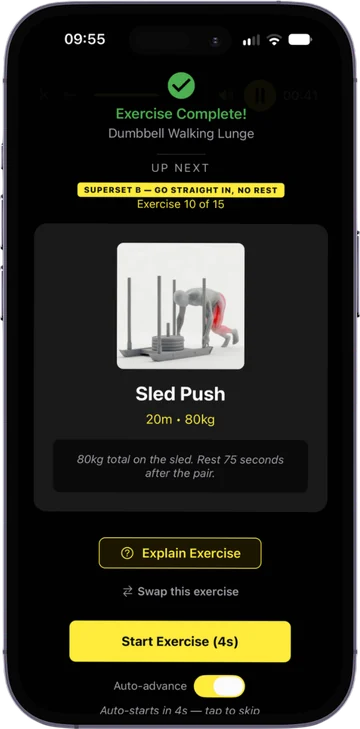
The RoxHype app is your training plan to race day: built from your splits, your kit and your race date, and adjusted every week.
- A week-by-week plan that counts down to your race
- Extra work on your slowest stations
- Adjusts every week to what you actually did
Free to download. Used by more than 40,000 HYROX athletes.