HYROX Budapest
Running was 49% of the typical Open finish here, close to the normal 48%.
Every edition
| Edition | Finishers | Open Men | Open Women | Running share |
|---|---|---|---|---|
| Budapest 2026 17 Oct | 2,586 | 1:25:08 | 1:33:46 | 49% |
Running share: how much of the typical Open finish was clocked as running at that edition; about 48% is normal.
Running share by edition
This line shows how much of the typical Open finish was running at each edition here, oldest on the left; the dashed line is the normal 48%.It was 49% at the one edition with an Open field.
See the numbers
| Edition | Running share |
|---|---|
| 2026 | 48.8% |
A venue whose run share moves between editions has changed its timing layout or its course. That is why the correction is computed per edition, never as one number per city.
Every station at Budapest, against every venue
Running was 49% of the typical race here, 48% across every venue. The fastest: wall balls, 1:12 faster.
Running was 49% of the typical race here, 49% across every venue. The station that ran slowest against the season: row, 0:04 slower. The fastest: burpee broad jump, 0:37 faster.
How to read
The two bars are the typical race here and at every venue, cut into runs, stations and roxzone. Under them: green was faster here than the season's typical, orange slower.
What the field did here, by division
Open Men finish times
This chart shows how many athletes finished in each 2.5-minute band, fastest on the left.A field of normal spread: typical 1:25:08, middle half about 1:16:01 to 1:36:09, fastest 10% (green) under 1:07:06.
See the numbers
| Time band | How many | Share |
|---|---|---|
| 55:00 to 57:30 | 2 | 0.4% |
| 57:30 to 1:00:00 | 5 | 1.0% |
| 1:00:00 to 1:02:30 | 8 | 1.6% |
| 1:02:30 to 1:05:00 | 20 | 3.9% |
| 1:05:00 to 1:07:30 | 18 | 3.5% |
| 1:07:30 to 1:10:00 | 13 | 2.5% |
| 1:10:00 to 1:12:30 | 20 | 3.9% |
| 1:12:30 to 1:15:00 | 33 | 6.4% |
| 1:15:00 to 1:17:30 | 30 | 5.8% |
| 1:17:30 to 1:20:00 | 32 | 6.2% |
| 1:20:00 to 1:22:30 | 34 | 6.6% |
| 1:22:30 to 1:25:00 | 37 | 7.2% |
| 1:25:00 to 1:27:30 | 51 | 9.9% |
| 1:27:30 to 1:30:00 | 21 | 4.1% |
| 1:30:00 to 1:32:30 | 29 | 5.6% |
| 1:32:30 to 1:35:00 | 23 | 4.5% |
| 1:35:00 to 1:37:30 | 23 | 4.5% |
| 1:37:30 to 1:40:00 | 17 | 3.3% |
| 1:40:00 to 1:42:30 | 20 | 3.9% |
| 1:42:30 to 1:45:00 | 18 | 3.5% |
| 1:45:00 to 1:47:30 | 16 | 3.1% |
| 1:47:30 to 1:50:00 | 7 | 1.4% |
| 1:50:00 to 1:52:30 | 7 | 1.4% |
| 1:52:30 to 1:55:00 | 3 | 0.6% |
| 1:55:00 to 1:57:30 | 3 | 0.6% |
| 1:57:30 to 2:00:00 | 9 | 1.7% |
| 2:00:00 to 2:02:30 | 3 | 0.6% |
| 2:02:30 to 2:05:00 | 1 | 0.2% |
| 2:05:00 to 2:07:30 | 1 | 0.2% |
| 2:07:30 to 2:10:00 | 2 | 0.4% |
| 2:10:00 to 2:12:30 | 1 | 0.2% |
| 2:12:30 to 2:15:00 | 1 | 0.2% |
| 2:15:00 to 2:17:30 | 2 | 0.4% |
| 2:17:30 to 2:20:00 | 2 | 0.4% |
| 2:20:00 to 2:22:30 | 1 | 0.2% |
| 2:22:30 to 2:25:00 | 0 | 0.0% |
| 2:25:00 to 2:27:30 | 2 | 0.4% |
How to read
Each bar is how many finished in that time slot. Green is the fastest 10%; the dotted line is the typical finish.
Every station here, against the season
| Part | Here | vs season |
|---|---|---|
| SkiErg | 4:31 | 0:09 faster |
| Sled push | 2:59 | 0:22 faster |
| Sled pull | 4:35 | 0:33 faster |
| Burpee broad jump | 5:25 | 0:27 faster |
| Row | 5:00 | 0:01 faster |
| Farmers carry | 1:59 | 0:19 faster |
| Sandbag lunges | 4:54 | 0:44 faster |
| Wall balls | 6:30 | 1:12 faster |
| Roxzone | 6:44 | 1:17 faster |
| Runs (8 km) | 40:44 | 2:42 faster |
How to read
The typical Open Men split here against the season's typical. Green is faster here, orange slower.
Open Women finish times
This chart shows how many athletes finished in each 2.5-minute band, fastest on the left.A field of normal spread: typical 1:33:46, middle half about 1:24:18 to 1:46:19, fastest 10% (green) under 1:17:09.
See the numbers
| Time band | How many | Share |
|---|---|---|
| 1:02:30 to 1:05:00 | 1 | 0.3% |
| 1:05:00 to 1:07:30 | 2 | 0.5% |
| 1:07:30 to 1:10:00 | 4 | 1.0% |
| 1:10:00 to 1:12:30 | 6 | 1.5% |
| 1:12:30 to 1:15:00 | 11 | 2.8% |
| 1:15:00 to 1:17:30 | 16 | 4.1% |
| 1:17:30 to 1:20:00 | 21 | 5.4% |
| 1:20:00 to 1:22:30 | 24 | 6.2% |
| 1:22:30 to 1:25:00 | 17 | 4.4% |
| 1:25:00 to 1:27:30 | 21 | 5.4% |
| 1:27:30 to 1:30:00 | 33 | 8.5% |
| 1:30:00 to 1:32:30 | 28 | 7.2% |
| 1:32:30 to 1:35:00 | 18 | 4.6% |
| 1:35:00 to 1:37:30 | 28 | 7.2% |
| 1:37:30 to 1:40:00 | 19 | 4.9% |
| 1:40:00 to 1:42:30 | 16 | 4.1% |
| 1:42:30 to 1:45:00 | 14 | 3.6% |
| 1:45:00 to 1:47:30 | 23 | 5.9% |
| 1:47:30 to 1:50:00 | 15 | 3.9% |
| 1:50:00 to 1:52:30 | 15 | 3.9% |
| 1:52:30 to 1:55:00 | 9 | 2.3% |
| 1:55:00 to 1:57:30 | 7 | 1.8% |
| 1:57:30 to 2:00:00 | 9 | 2.3% |
| 2:00:00 to 2:02:30 | 6 | 1.5% |
| 2:02:30 to 2:05:00 | 3 | 0.8% |
| 2:05:00 to 2:07:30 | 1 | 0.3% |
| 2:07:30 to 2:10:00 | 3 | 0.8% |
| 2:10:00 to 2:12:30 | 5 | 1.3% |
| 2:12:30 to 2:15:00 | 1 | 0.3% |
| 2:15:00 to 2:17:30 | 2 | 0.5% |
| 2:17:30 to 2:20:00 | 1 | 0.3% |
| 2:20:00 to 2:22:30 | 0 | 0.0% |
| 2:22:30 to 2:25:00 | 1 | 0.3% |
| 2:25:00 to 2:27:30 | 3 | 0.8% |
| 2:27:30 to 2:30:00 | 0 | 0.0% |
| 2:30:00 to 2:32:30 | 0 | 0.0% |
| 2:32:30 to 2:35:00 | 0 | 0.0% |
| 2:35:00 to 2:37:30 | 2 | 0.5% |
| 2:37:30 to 2:40:00 | 3 | 0.8% |
| 2:40:00 to 2:42:30 | 0 | 0.0% |
| 2:42:30 to 2:45:00 | 0 | 0.0% |
| 2:45:00 to 2:47:30 | 0 | 0.0% |
| 2:47:30 to 2:50:00 | 0 | 0.0% |
| 2:50:00 to 2:52:30 | 0 | 0.0% |
| 2:52:30 to 2:55:00 | 0 | 0.0% |
| 2:55:00 to 2:57:30 | 0 | 0.0% |
| 2:57:30 to 3:00:00 | 0 | 0.0% |
| 3:00:00 to 3:02:30 | 0 | 0.0% |
| 3:02:30 to 3:05:00 | 0 | 0.0% |
| 3:05:00 to 3:07:30 | 0 | 0.0% |
| 3:07:30 to 3:10:00 | 0 | 0.0% |
| 3:10:00 to 3:12:30 | 0 | 0.0% |
| 3:12:30 to 3:15:00 | 0 | 0.0% |
| 3:15:00 to 3:17:30 | 0 | 0.0% |
| 3:17:30 to 3:20:00 | 1 | 0.3% |
How to read
Each bar is how many finished in that time slot. Green is the fastest 10%; the dotted line is the typical finish.
Every station here, against the season
| Part | Here | vs season |
|---|---|---|
| SkiErg | 5:19 | 0:05 faster |
| Sled push | 3:03 | 0:07 faster |
| Sled pull | 5:29 | 0:25 faster |
| Burpee broad jump | 6:26 | 0:37 faster |
| Row | 5:42 | 0:04 slower |
| Farmers carry | 2:13 | 0:10 faster |
| Sandbag lunges | 4:53 | 0:35 faster |
| Wall balls | 6:33 | 0:36 faster |
| Roxzone | 7:38 | 0:46 faster |
| Runs (8 km) | 45:30 | 2:38 faster |
How to read
The typical Open Women split here against the season's typical. Green is faster here, orange slower.
Doubles Men finish times
This chart shows how many teams finished in each 2.5-minute band, fastest on the left.A field of normal spread: typical 1:16:44, middle half about 1:09:10 to 1:27:04, fastest 10% (green) under 1:02:13.
See the numbers
| Time band | How many | Share |
|---|---|---|
| 52:30 to 55:00 | 2 | 0.7% |
| 55:00 to 57:30 | 5 | 1.7% |
| 57:30 to 1:00:00 | 12 | 4.1% |
| 1:00:00 to 1:02:30 | 13 | 4.4% |
| 1:02:30 to 1:05:00 | 17 | 5.8% |
| 1:05:00 to 1:07:30 | 13 | 4.4% |
| 1:07:30 to 1:10:00 | 22 | 7.5% |
| 1:10:00 to 1:12:30 | 20 | 6.8% |
| 1:12:30 to 1:15:00 | 26 | 8.9% |
| 1:15:00 to 1:17:30 | 21 | 7.2% |
| 1:17:30 to 1:20:00 | 20 | 6.8% |
| 1:20:00 to 1:22:30 | 17 | 5.8% |
| 1:22:30 to 1:25:00 | 17 | 5.8% |
| 1:25:00 to 1:27:30 | 16 | 5.5% |
| 1:27:30 to 1:30:00 | 20 | 6.8% |
| 1:30:00 to 1:32:30 | 15 | 5.1% |
| 1:32:30 to 1:35:00 | 13 | 4.4% |
| 1:35:00 to 1:37:30 | 6 | 2.0% |
| 1:37:30 to 1:40:00 | 4 | 1.4% |
| 1:40:00 to 1:42:30 | 3 | 1.0% |
| 1:42:30 to 1:45:00 | 3 | 1.0% |
| 1:45:00 to 1:47:30 | 1 | 0.3% |
| 1:47:30 to 1:50:00 | 3 | 1.0% |
| 1:50:00 to 1:52:30 | 1 | 0.3% |
| 1:52:30 to 1:55:00 | 1 | 0.3% |
| 1:55:00 to 1:57:30 | 0 | 0.0% |
| 1:57:30 to 2:00:00 | 0 | 0.0% |
| 2:00:00 to 2:02:30 | 1 | 0.3% |
| 2:02:30 to 2:05:00 | 0 | 0.0% |
| 2:05:00 to 2:07:30 | 0 | 0.0% |
| 2:07:30 to 2:10:00 | 1 | 0.3% |
How to read
Each bar is how many finished in that time slot. Green is the fastest 10%; the dotted line is the typical finish.
Every station here, against the season
| Part | Here | vs season |
|---|---|---|
| SkiErg | 4:07 | 0:03 faster |
| Sled push | 1:56 | 0:04 faster |
| Sled pull | 3:26 | 0:08 faster |
| Burpee broad jump | 3:21 | 0:03 faster |
| Row | 4:44 | 0:04 slower |
| Farmers carry | 1:41 | 0:02 faster |
| Sandbag lunges | 3:36 | 0:14 faster |
| Wall balls | 4:19 | 0:16 faster |
| Roxzone | 6:40 | 0:38 faster |
| Runs (8 km) | 42:27 | 1:51 faster |
How to read
The typical Doubles Men split here against the season's typical. Green is faster here, orange slower.
Doubles Women finish times
This chart shows how many teams finished in each 2.5-minute band, fastest on the left.A field of normal spread: typical 1:25:22, middle half about 1:17:19 to 1:33:46, fastest 10% (green) under 1:12:18.
See the numbers
| Time band | How many | Share |
|---|---|---|
| 1:00:00 to 1:02:30 | 1 | 0.3% |
| 1:02:30 to 1:05:00 | 1 | 0.3% |
| 1:05:00 to 1:07:30 | 6 | 1.5% |
| 1:07:30 to 1:10:00 | 13 | 3.3% |
| 1:10:00 to 1:12:30 | 20 | 5.1% |
| 1:12:30 to 1:15:00 | 19 | 4.8% |
| 1:15:00 to 1:17:30 | 39 | 9.9% |
| 1:17:30 to 1:20:00 | 28 | 7.1% |
| 1:20:00 to 1:22:30 | 37 | 9.4% |
| 1:22:30 to 1:25:00 | 31 | 7.9% |
| 1:25:00 to 1:27:30 | 37 | 9.4% |
| 1:27:30 to 1:30:00 | 21 | 5.3% |
| 1:30:00 to 1:32:30 | 27 | 6.9% |
| 1:32:30 to 1:35:00 | 26 | 6.6% |
| 1:35:00 to 1:37:30 | 23 | 5.9% |
| 1:37:30 to 1:40:00 | 14 | 3.6% |
| 1:40:00 to 1:42:30 | 12 | 3.1% |
| 1:42:30 to 1:45:00 | 7 | 1.8% |
| 1:45:00 to 1:47:30 | 8 | 2.0% |
| 1:47:30 to 1:50:00 | 7 | 1.8% |
| 1:50:00 to 1:52:30 | 2 | 0.5% |
| 1:52:30 to 1:55:00 | 2 | 0.5% |
| 1:55:00 to 1:57:30 | 3 | 0.8% |
| 1:57:30 to 2:00:00 | 2 | 0.5% |
| 2:00:00 to 2:02:30 | 2 | 0.5% |
| 2:02:30 to 2:05:00 | 1 | 0.3% |
| 2:05:00 to 2:07:30 | 0 | 0.0% |
| 2:07:30 to 2:10:00 | 1 | 0.3% |
| 2:10:00 to 2:12:30 | 1 | 0.3% |
| 2:12:30 to 2:15:00 | 0 | 0.0% |
| 2:15:00 to 2:17:30 | 0 | 0.0% |
| 2:17:30 to 2:20:00 | 1 | 0.3% |
| 2:20:00 to 2:22:30 | 0 | 0.0% |
| 2:22:30 to 2:25:00 | 0 | 0.0% |
| 2:25:00 to 2:27:30 | 0 | 0.0% |
| 2:27:30 to 2:30:00 | 0 | 0.0% |
| 2:30:00 to 2:32:30 | 1 | 0.3% |
How to read
Each bar is how many finished in that time slot. Green is the fastest 10%; the dotted line is the typical finish.
Every station here, against the season
| Part | Here | vs season |
|---|---|---|
| SkiErg | 4:51 | 0:04 faster |
| Sled push | 2:02 | 0:04 slower |
| Sled pull | 4:12 | 0:12 faster |
| Burpee broad jump | 4:04 | 0:27 faster |
| Row | 5:17 | 0:01 faster |
| Farmers carry | 1:49 | 0:05 faster |
| Sandbag lunges | 3:27 | 0:32 faster |
| Wall balls | 4:08 | 0:23 faster |
| Roxzone | 7:15 | 1:02 faster |
| Runs (8 km) | 46:54 | 3:54 faster |
How to read
The typical Doubles Women split here against the season's typical. Green is faster here, orange slower.
Doubles Mixed finish times
This chart shows how many teams finished in each 2.5-minute band, fastest on the left.A field of normal spread: typical 1:18:19, middle half about 1:10:28 to 1:26:16, fastest 10% (green) under 1:03:16.
See the numbers
| Time band | How many | Share |
|---|---|---|
| 50:00 to 52:30 | 1 | 0.2% |
| 52:30 to 55:00 | 1 | 0.2% |
| 55:00 to 57:30 | 10 | 2.4% |
| 57:30 to 1:00:00 | 15 | 3.5% |
| 1:00:00 to 1:02:30 | 10 | 2.4% |
| 1:02:30 to 1:05:00 | 17 | 4.0% |
| 1:05:00 to 1:07:30 | 20 | 4.7% |
| 1:07:30 to 1:10:00 | 29 | 6.8% |
| 1:10:00 to 1:12:30 | 35 | 8.2% |
| 1:12:30 to 1:15:00 | 31 | 7.3% |
| 1:15:00 to 1:17:30 | 36 | 8.5% |
| 1:17:30 to 1:20:00 | 28 | 6.6% |
| 1:20:00 to 1:22:30 | 32 | 7.5% |
| 1:22:30 to 1:25:00 | 33 | 7.8% |
| 1:25:00 to 1:27:30 | 36 | 8.5% |
| 1:27:30 to 1:30:00 | 19 | 4.5% |
| 1:30:00 to 1:32:30 | 17 | 4.0% |
| 1:32:30 to 1:35:00 | 16 | 3.8% |
| 1:35:00 to 1:37:30 | 9 | 2.1% |
| 1:37:30 to 1:40:00 | 5 | 1.2% |
| 1:40:00 to 1:42:30 | 6 | 1.4% |
| 1:42:30 to 1:45:00 | 5 | 1.2% |
| 1:45:00 to 1:47:30 | 4 | 0.9% |
| 1:47:30 to 1:50:00 | 3 | 0.7% |
| 1:50:00 to 1:52:30 | 0 | 0.0% |
| 1:52:30 to 1:55:00 | 1 | 0.2% |
| 1:55:00 to 1:57:30 | 1 | 0.2% |
| 1:57:30 to 2:00:00 | 2 | 0.5% |
| 2:00:00 to 2:02:30 | 2 | 0.5% |
| 2:02:30 to 2:05:00 | 0 | 0.0% |
| 2:05:00 to 2:07:30 | 0 | 0.0% |
| 2:07:30 to 2:10:00 | 0 | 0.0% |
| 2:10:00 to 2:12:30 | 0 | 0.0% |
| 2:12:30 to 2:15:00 | 0 | 0.0% |
| 2:15:00 to 2:17:30 | 0 | 0.0% |
| 2:17:30 to 2:20:00 | 0 | 0.0% |
| 2:20:00 to 2:22:30 | 0 | 0.0% |
| 2:22:30 to 2:25:00 | 0 | 0.0% |
| 2:25:00 to 2:27:30 | 1 | 0.2% |
How to read
Each bar is how many finished in that time slot. Green is the fastest 10%; the dotted line is the typical finish.
Every station here, against the season
| Part | Here | vs season |
|---|---|---|
| SkiErg | 4:18 | 0:08 faster |
| Sled push | 2:17 | 0:03 faster |
| Sled pull | 3:43 | 0:24 faster |
| Burpee broad jump | 3:22 | 0:22 faster |
| Row | 4:50 | 0:03 faster |
| Farmers carry | 1:44 | 0:08 faster |
| Sandbag lunges | 3:42 | 0:32 faster |
| Wall balls | 4:16 | 0:32 faster |
| Roxzone | 6:15 | 1:27 faster |
| Runs (8 km) | 42:33 | 4:25 faster |
How to read
The typical Doubles Mixed split here against the season's typical. Green is faster here, orange slower.
Pro Men finish times
This chart shows how many athletes finished in each 2.5-minute band, fastest on the left.A field of normal spread with a long slow tail: typical 1:14:24, middle half about 1:06:46 to 1:24:23, fastest 10% (green) under 1:01:48.
See the numbers
| Time band | How many | Share |
|---|---|---|
| 52:30 to 55:00 | 2 | 1.0% |
| 55:00 to 57:30 | 5 | 2.4% |
| 57:30 to 1:00:00 | 8 | 3.8% |
| 1:00:00 to 1:02:30 | 12 | 5.7% |
| 1:02:30 to 1:05:00 | 14 | 6.7% |
| 1:05:00 to 1:07:30 | 19 | 9.0% |
| 1:07:30 to 1:10:00 | 20 | 9.5% |
| 1:10:00 to 1:12:30 | 14 | 6.7% |
| 1:12:30 to 1:15:00 | 16 | 7.6% |
| 1:15:00 to 1:17:30 | 14 | 6.7% |
| 1:17:30 to 1:20:00 | 17 | 8.1% |
| 1:20:00 to 1:22:30 | 10 | 4.8% |
| 1:22:30 to 1:25:00 | 8 | 3.8% |
| 1:25:00 to 1:27:30 | 7 | 3.3% |
| 1:27:30 to 1:30:00 | 4 | 1.9% |
| 1:30:00 to 1:32:30 | 7 | 3.3% |
| 1:32:30 to 1:35:00 | 7 | 3.3% |
| 1:35:00 to 1:37:30 | 3 | 1.4% |
| 1:37:30 to 1:40:00 | 5 | 2.4% |
| 1:40:00 to 1:42:30 | 4 | 1.9% |
| 1:42:30 to 1:45:00 | 2 | 1.0% |
| 1:45:00 to 1:47:30 | 3 | 1.4% |
| 1:47:30 to 1:50:00 | 0 | 0.0% |
| 1:50:00 to 1:52:30 | 4 | 1.9% |
| 1:52:30 to 1:55:00 | 0 | 0.0% |
| 1:55:00 to 1:57:30 | 1 | 0.5% |
| 1:57:30 to 2:00:00 | 1 | 0.5% |
| 2:00:00 to 2:02:30 | 0 | 0.0% |
| 2:02:30 to 2:05:00 | 1 | 0.5% |
| 2:05:00 to 2:07:30 | 0 | 0.0% |
| 2:07:30 to 2:10:00 | 0 | 0.0% |
| 2:10:00 to 2:12:30 | 0 | 0.0% |
| 2:12:30 to 2:15:00 | 0 | 0.0% |
| 2:15:00 to 2:17:30 | 0 | 0.0% |
| 2:17:30 to 2:20:00 | 1 | 0.5% |
| 2:20:00 to 2:22:30 | 0 | 0.0% |
| 2:22:30 to 2:25:00 | 0 | 0.0% |
| 2:25:00 to 2:27:30 | 0 | 0.0% |
| 2:27:30 to 2:30:00 | 1 | 0.5% |
How to read
Each bar is how many finished in that time slot. Green is the fastest 10%; the dotted line is the typical finish.
Every station here, against the season
| Part | Here | vs season |
|---|---|---|
| SkiErg | 4:18 | 0:03 faster |
| Sled push | 3:48 | 0:10 faster |
| Sled pull | 4:48 | 0:43 faster |
| Burpee broad jump | 3:47 | 0:39 faster |
| Row | 4:36 | 0:02 faster |
| Farmers carry | 1:55 | 0:20 faster |
| Sandbag lunges | 4:23 | 0:41 faster |
| Wall balls | 6:03 | 1:06 faster |
| Roxzone | 5:05 | 1:15 faster |
| Runs (8 km) | 34:21 | 2:51 faster |
How to read
The typical Pro Men split here against the season's typical. Green is faster here, orange slower.
Pro Women finish times
This chart shows how many athletes finished in each 2.5-minute band, fastest on the left.A field of normal spread: typical 1:26:32, middle half about 1:17:06 to 1:34:44, fastest 10% (green) under 1:12:12.
See the numbers
| Time band | How many | Share |
|---|---|---|
| 57:30 to 1:00:00 | 2 | 2.3% |
| 1:00:00 to 1:02:30 | 0 | 0.0% |
| 1:02:30 to 1:05:00 | 0 | 0.0% |
| 1:05:00 to 1:07:30 | 0 | 0.0% |
| 1:07:30 to 1:10:00 | 4 | 4.5% |
| 1:10:00 to 1:12:30 | 4 | 4.5% |
| 1:12:30 to 1:15:00 | 9 | 10.2% |
| 1:15:00 to 1:17:30 | 4 | 4.5% |
| 1:17:30 to 1:20:00 | 8 | 9.1% |
| 1:20:00 to 1:22:30 | 3 | 3.4% |
| 1:22:30 to 1:25:00 | 7 | 8.0% |
| 1:25:00 to 1:27:30 | 7 | 8.0% |
| 1:27:30 to 1:30:00 | 9 | 10.2% |
| 1:30:00 to 1:32:30 | 5 | 5.7% |
| 1:32:30 to 1:35:00 | 4 | 4.5% |
| 1:35:00 to 1:37:30 | 2 | 2.3% |
| 1:37:30 to 1:40:00 | 4 | 4.5% |
| 1:40:00 to 1:42:30 | 3 | 3.4% |
| 1:42:30 to 1:45:00 | 1 | 1.1% |
| 1:45:00 to 1:47:30 | 4 | 4.5% |
| 1:47:30 to 1:50:00 | 4 | 4.5% |
| 1:50:00 to 1:52:30 | 0 | 0.0% |
| 1:52:30 to 1:55:00 | 0 | 0.0% |
| 1:55:00 to 1:57:30 | 0 | 0.0% |
| 1:57:30 to 2:00:00 | 2 | 2.3% |
| 2:00:00 to 2:02:30 | 1 | 1.1% |
| 2:02:30 to 2:05:00 | 0 | 0.0% |
| 2:05:00 to 2:07:30 | 0 | 0.0% |
| 2:07:30 to 2:10:00 | 0 | 0.0% |
| 2:10:00 to 2:12:30 | 0 | 0.0% |
| 2:12:30 to 2:15:00 | 1 | 1.1% |
How to read
Each bar is how many finished in that time slot. Green is the fastest 10%; the dotted line is the typical finish.
Every station here, against the season
| Part | Here | vs season |
|---|---|---|
| SkiErg | 4:59 | level |
| Sled push | 4:31 | 0:19 slower |
| Sled pull | 5:51 | 0:14 slower |
| Burpee broad jump | 5:12 | 0:01 faster |
| Row | 5:21 | 0:11 slower |
| Farmers carry | 2:39 | 0:02 faster |
| Sandbag lunges | 4:54 | 0:20 faster |
| Wall balls | 6:04 | 0:18 faster |
| Roxzone | 6:16 | 0:28 faster |
| Runs (8 km) | 38:53 | 1:50 faster |
How to read
The typical Pro Women split here against the season's typical. Green is faster here, orange slower.
Pro Doubles Men finish times
This chart shows how many teams finished in each 2.5-minute band, fastest on the left.A field of normal spread with a long slow tail: typical 1:02:24, middle half about 57:54 to 1:09:57, fastest 10% (green) under 54:11.
See the numbers
| Time band | How many | Share |
|---|---|---|
| 47:30 to 50:00 | 1 | 1.2% |
| 50:00 to 52:30 | 3 | 3.6% |
| 52:30 to 55:00 | 7 | 8.3% |
| 55:00 to 57:30 | 7 | 8.3% |
| 57:30 to 1:00:00 | 14 | 16.7% |
| 1:00:00 to 1:02:30 | 10 | 11.9% |
| 1:02:30 to 1:05:00 | 5 | 6.0% |
| 1:05:00 to 1:07:30 | 9 | 10.7% |
| 1:07:30 to 1:10:00 | 7 | 8.3% |
| 1:10:00 to 1:12:30 | 5 | 6.0% |
| 1:12:30 to 1:15:00 | 3 | 3.6% |
| 1:15:00 to 1:17:30 | 2 | 2.4% |
| 1:17:30 to 1:20:00 | 1 | 1.2% |
| 1:20:00 to 1:22:30 | 4 | 4.8% |
| 1:22:30 to 1:25:00 | 3 | 3.6% |
| 1:25:00 to 1:27:30 | 2 | 2.4% |
| 1:27:30 to 1:30:00 | 0 | 0.0% |
| 1:30:00 to 1:32:30 | 1 | 1.2% |
How to read
Each bar is how many finished in that time slot. Green is the fastest 10%; the dotted line is the typical finish.
Every station here, against the season
| Part | Here | vs season |
|---|---|---|
| SkiErg | 3:47 | 0:09 faster |
| Sled push | 2:16 | 0:06 faster |
| Sled pull | 3:32 | 0:32 faster |
| Burpee broad jump | 2:27 | 0:17 faster |
| Row | 4:16 | 0:03 faster |
| Farmers carry | 1:34 | 0:07 faster |
| Sandbag lunges | 3:06 | 0:32 faster |
| Wall balls | 3:53 | 0:23 faster |
| Roxzone | 4:31 | 1:09 faster |
| Runs (8 km) | 32:56 | 4:36 faster |
How to read
The typical Pro Doubles Men split here against the season's typical. Green is faster here, orange slower.
Pro Doubles Women finish times
This chart shows how many teams finished in each 2.5-minute band, fastest on the left.A field of normal spread with a long slow tail: typical 1:13:03, middle half about 1:07:28 to 1:22:12, fastest 10% (green) under 1:02:12.
See the numbers
| Time band | How many | Share |
|---|---|---|
| 55:00 to 57:30 | 1 | 1.3% |
| 57:30 to 1:00:00 | 5 | 6.3% |
| 1:00:00 to 1:02:30 | 4 | 5.0% |
| 1:02:30 to 1:05:00 | 8 | 10.0% |
| 1:05:00 to 1:07:30 | 2 | 2.5% |
| 1:07:30 to 1:10:00 | 11 | 13.8% |
| 1:10:00 to 1:12:30 | 8 | 10.0% |
| 1:12:30 to 1:15:00 | 6 | 7.5% |
| 1:15:00 to 1:17:30 | 3 | 3.8% |
| 1:17:30 to 1:20:00 | 9 | 11.3% |
| 1:20:00 to 1:22:30 | 3 | 3.8% |
| 1:22:30 to 1:25:00 | 2 | 2.5% |
| 1:25:00 to 1:27:30 | 3 | 3.8% |
| 1:27:30 to 1:30:00 | 4 | 5.0% |
| 1:30:00 to 1:32:30 | 1 | 1.3% |
| 1:32:30 to 1:35:00 | 2 | 2.5% |
| 1:35:00 to 1:37:30 | 1 | 1.3% |
| 1:37:30 to 1:40:00 | 3 | 3.8% |
| 1:40:00 to 1:42:30 | 0 | 0.0% |
| 1:42:30 to 1:45:00 | 0 | 0.0% |
| 1:45:00 to 1:47:30 | 0 | 0.0% |
| 1:47:30 to 1:50:00 | 1 | 1.3% |
| 1:50:00 to 1:52:30 | 2 | 2.5% |
| 1:52:30 to 1:55:00 | 1 | 1.3% |
How to read
Each bar is how many finished in that time slot. Green is the fastest 10%; the dotted line is the typical finish.
Every station here, against the season
| Part | Here | vs season |
|---|---|---|
| SkiErg | 4:27 | 0:06 faster |
| Sled push | 2:34 | 0:05 faster |
| Sled pull | 4:13 | 0:09 faster |
| Burpee broad jump | 3:17 | 0:12 faster |
| Row | 4:54 | 0:01 faster |
| Farmers carry | 1:51 | 0:06 faster |
| Sandbag lunges | 3:27 | 0:34 faster |
| Wall balls | 3:49 | 0:22 faster |
| Roxzone | 5:12 | 1:21 faster |
| Runs (8 km) | 39:09 | 3:53 faster |
How to read
The typical Pro Doubles Women split here against the season's typical. Green is faster here, orange slower.
Relay Mixed finish times
This chart shows how many teams finished in each 2.5-minute band, fastest on the left.A widely spread field: typical 1:16:16, middle half about 1:03:24 to 1:32:15, fastest 10% (green) under 57:41.
See the numbers
| Time band | How many | Share |
|---|---|---|
| 50:00 to 52:30 | 1 | 1.9% |
| 52:30 to 55:00 | 1 | 1.9% |
| 55:00 to 57:30 | 4 | 7.4% |
| 57:30 to 1:00:00 | 2 | 3.7% |
| 1:00:00 to 1:02:30 | 3 | 5.6% |
| 1:02:30 to 1:05:00 | 4 | 7.4% |
| 1:05:00 to 1:07:30 | 2 | 3.7% |
| 1:07:30 to 1:10:00 | 2 | 3.7% |
| 1:10:00 to 1:12:30 | 4 | 7.4% |
| 1:12:30 to 1:15:00 | 2 | 3.7% |
| 1:15:00 to 1:17:30 | 4 | 7.4% |
| 1:17:30 to 1:20:00 | 1 | 1.9% |
| 1:20:00 to 1:22:30 | 3 | 5.6% |
| 1:22:30 to 1:25:00 | 2 | 3.7% |
| 1:25:00 to 1:27:30 | 2 | 3.7% |
| 1:27:30 to 1:30:00 | 3 | 5.6% |
| 1:30:00 to 1:32:30 | 0 | 0.0% |
| 1:32:30 to 1:35:00 | 2 | 3.7% |
| 1:35:00 to 1:37:30 | 1 | 1.9% |
| 1:37:30 to 1:40:00 | 4 | 7.4% |
| 1:40:00 to 1:42:30 | 0 | 0.0% |
| 1:42:30 to 1:45:00 | 3 | 5.6% |
| 1:45:00 to 1:47:30 | 1 | 1.9% |
| 1:47:30 to 1:50:00 | 1 | 1.9% |
| 1:50:00 to 1:52:30 | 1 | 1.9% |
| 1:52:30 to 1:55:00 | 0 | 0.0% |
| 1:55:00 to 1:57:30 | 0 | 0.0% |
| 1:57:30 to 2:00:00 | 0 | 0.0% |
| 2:00:00 to 2:02:30 | 0 | 0.0% |
| 2:02:30 to 2:05:00 | 0 | 0.0% |
| 2:05:00 to 2:07:30 | 0 | 0.0% |
| 2:07:30 to 2:10:00 | 0 | 0.0% |
| 2:10:00 to 2:12:30 | 0 | 0.0% |
| 2:12:30 to 2:15:00 | 0 | 0.0% |
| 2:15:00 to 2:17:30 | 0 | 0.0% |
| 2:17:30 to 2:20:00 | 0 | 0.0% |
| 2:20:00 to 2:22:30 | 0 | 0.0% |
| 2:22:30 to 2:25:00 | 1 | 1.9% |
How to read
Each bar is how many finished in that time slot. Green is the fastest 10%; the dotted line is the typical finish.
Every station here, against the season
| Part | Here | vs season |
|---|---|---|
| SkiErg | 4:42 | 0:30 faster |
| Sled push | 2:49 | 0:16 faster |
| Sled pull | 3:52 | 0:53 faster |
| Burpee broad jump | 4:27 | 0:42 faster |
| Row | 4:40 | 0:27 faster |
| Farmers carry | 1:47 | 0:18 faster |
| Sandbag lunges | 4:09 | 0:38 faster |
| Wall balls | 4:55 | 0:52 faster |
| Roxzone | 5:38 | 1:12 faster |
| Runs (8 km) | 39:02 | 1:30 faster |
How to read
The typical Relay Mixed split here against the season's typical. Green is faster here, orange slower.
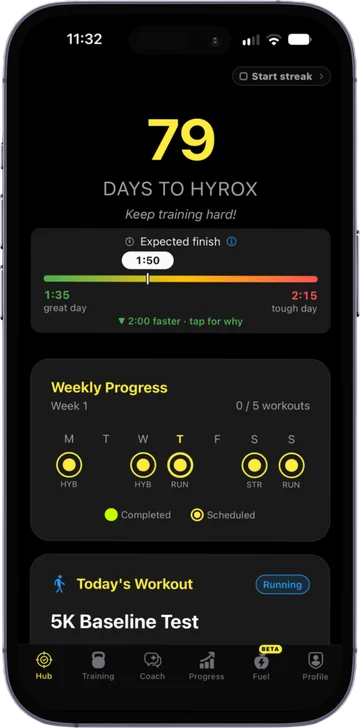
Train for your next race. Beat this time.
The RoxHype app is your training plan to race day: built from your splits, your kit and your race date, and adjusted every week.
- A week-by-week plan that counts down to your race
- Extra work on your slowest stations
- Adjusts every week to what you actually did
Free to download. Used by more than 40,000 HYROX athletes.