
HYROX Hamburg 2026 results
12,511 finishes so far. Find your name for your race report.
Find your result
| Race day | # | Athlete | Age group | Time |
|---|
Provisional lists, by race day. Tap your name for your full race report.
Pick your race day
Finish times, Open · Wednesday
This chart shows how many athletes finished in each 2.5-minute band, fastest on the left.A field of normal spread: typical 1:34:43, middle half about 1:23:49 to 1:47:59, fastest 10% (green) under 1:16:57.
See the numbers
| Time band | How many | Share |
|---|---|---|
| 57:30 to 1:00:00 | 2 | 0.2% |
| 1:00:00 to 1:02:30 | 3 | 0.3% |
| 1:02:30 to 1:05:00 | 6 | 0.7% |
| 1:05:00 to 1:07:30 | 11 | 1.2% |
| 1:07:30 to 1:10:00 | 11 | 1.2% |
| 1:10:00 to 1:12:30 | 19 | 2.1% |
| 1:12:30 to 1:15:00 | 22 | 2.4% |
| 1:15:00 to 1:17:30 | 27 | 3.0% |
| 1:17:30 to 1:20:00 | 49 | 5.4% |
| 1:20:00 to 1:22:30 | 51 | 5.6% |
| 1:22:30 to 1:25:00 | 50 | 5.5% |
| 1:25:00 to 1:27:30 | 59 | 6.5% |
| 1:27:30 to 1:30:00 | 51 | 5.6% |
| 1:30:00 to 1:32:30 | 50 | 5.5% |
| 1:32:30 to 1:35:00 | 49 | 5.4% |
| 1:35:00 to 1:37:30 | 66 | 7.3% |
| 1:37:30 to 1:40:00 | 35 | 3.9% |
| 1:40:00 to 1:42:30 | 47 | 5.2% |
| 1:42:30 to 1:45:00 | 32 | 3.5% |
| 1:45:00 to 1:47:30 | 35 | 3.9% |
| 1:47:30 to 1:50:00 | 35 | 3.9% |
| 1:50:00 to 1:52:30 | 23 | 2.5% |
| 1:52:30 to 1:55:00 | 25 | 2.8% |
| 1:55:00 to 1:57:30 | 21 | 2.3% |
| 1:57:30 to 2:00:00 | 14 | 1.5% |
| 2:00:00 to 2:02:30 | 24 | 2.6% |
| 2:02:30 to 2:05:00 | 14 | 1.5% |
| 2:05:00 to 2:07:30 | 11 | 1.2% |
| 2:07:30 to 2:10:00 | 11 | 1.2% |
| 2:10:00 to 2:12:30 | 3 | 0.3% |
| 2:12:30 to 2:15:00 | 10 | 1.1% |
| 2:15:00 to 2:17:30 | 10 | 1.1% |
| 2:17:30 to 2:20:00 | 3 | 0.3% |
| 2:20:00 to 2:22:30 | 4 | 0.4% |
| 2:22:30 to 2:25:00 | 7 | 0.8% |
| 2:25:00 to 2:27:30 | 8 | 0.9% |
| 2:27:30 to 2:30:00 | 2 | 0.2% |
| 2:30:00 to 2:32:30 | 2 | 0.2% |
| 2:32:30 to 2:35:00 | 1 | 0.1% |
| 2:35:00 to 2:37:30 | 1 | 0.1% |
| 2:37:30 to 2:40:00 | 2 | 0.2% |
| 2:40:00 to 2:42:30 | 0 | 0.0% |
| 2:42:30 to 2:45:00 | 1 | 0.1% |
| 2:45:00 to 2:47:30 | 0 | 0.0% |
| 2:47:30 to 2:50:00 | 1 | 0.1% |
| 2:50:00 to 2:52:30 | 0 | 0.0% |
| 2:52:30 to 2:55:00 | 0 | 0.0% |
| 2:55:00 to 2:57:30 | 0 | 0.0% |
| 2:57:30 to 3:00:00 | 0 | 0.0% |
| 3:00:00 to 3:02:30 | 1 | 0.1% |
How to read
Each bar is how many finished in that time slot, fastest on the left, men and women together. Green is the fastest 10%; the line is the typical finish.
| # | Athlete | Age group | Time | |
|---|---|---|---|---|
| 1 | Nicolas Grimont BEL | 30-34 | 58:17 | |
| 2 | Lukas Dudziak GER | 30-34 | 59:37 | |
| 3 | Thomas Cortebeeck DEN | 40-44 | 1:01:23 | |
| 4 | Dean O’Halloran IRL | 30-34 | 1:01:26 | |
| 5 | Simon Foss Jensen DEN | 35-39 | 1:02:09 | |
| 6 | S.A. Hoekstra NED | 30-34 | 1:03:26 | |
| 7 | Hugo Acioli BRA | 25-29 | 1:03:43 | |
| 8 | Fynn Lauer GER | 25-29 | 1:04:31 | |
| 9 | Christoph Fedl AUT | 35-39 | 1:04:31 | |
| 10 | Jakub Masnicak CZE | 16-24 | 1:04:33 | |
| 11 | Niklas Baasch GER | 30-34 | 1:04:45 | |
| 12 | Brun Keller GER | 30-34 | 1:05:03 | |
| 13 | Devon Moore GBR | 25-29 | 1:05:22 | |
| 14 | Bennet Barre GER | 25-29 | 1:05:23 | |
| 15 | Dennis Sonne GER | 16-24 | 1:05:40 | |
| 16 | Joschka Schlicht GER | 30-34 | 1:05:46 | |
| 17 | Ronja Kräft GER | 16-24 | 1:05:56 | |
| 18 | Thomas Agersnap DEN | 30-34 | 1:06:16 | |
| 19 | Ulrik Vangsø Ørts DEN | 40-44 | 1:06:21 | |
| 20 | Patrick Paul GER | 45-49 | 1:06:28 | |
| 21 | Timon Pfennig GER | 25-29 | 1:06:31 | |
| 22 | Josa Rödiger GER | 35-39 | 1:06:54 | |
| 23 | Benedikt Knab GER | 35-39 | 1:07:48 | |
| 24 | Jan Fondermann GER | 30-34 | 1:07:55 | |
| 25 | Amanda Marschall Nielsen DEN | 30-34 | 1:08:39 | |
| 26 | Tobias Schadewaldt GER | 40-44 | 1:08:47 | |
| 27 | Zuzana Šašková CZE | 40-44 | 1:08:47 | |
| 28 | Lutz Wamser GER | 35-39 | 1:08:50 | |
| 29 | Christopher Rasch GER | 35-39 | 1:08:53 | |
| 30 | Adrian Saucke GER | 30-34 | 1:09:28 | |
| 31 | Ricardo Wendt GER | 16-24 | 1:09:45 | |
| 32 | Finnja Feldmann GER | 25-29 | 1:09:48 | |
| 33 | John Bruins NED | 16-24 | 1:09:49 | |
| 34 | Søren Schleidt DEN | 50-54 | 1:10:07 | |
| 35 | Petru Brataniuc MDA | 30-34 | 1:10:13 | |
| 36 | Philipp grotrian GER | 30-34 | 1:10:22 | |
| 37 | Pascal Kühl GER | 30-34 | 1:10:23 | |
| 38 | Tom Behnke GER | 16-24 | 1:10:41 | |
| 39 | Kevin Krützelmann GER | 30-34 | 1:10:45 | |
| 40 | Björn Fischer GER | 35-39 | 1:10:58 | |
| 41 | NATHAN BAZIN FRA | 30-34 | 1:11:00 | |
| 42 | Tobias Meyer GER | 16-24 | 1:11:07 | |
| 43 | Maike Okon GER | 30-34 | 1:11:23 | |
| 44 | Nitta Diddi Olesen DEN | 35-39 | 1:11:45 | |
| 45 | Andrew Sanchez USA | 16-24 | 1:11:46 | |
| 46 | Denni Patschinsky DEN | 40-44 | 1:11:48 | |
| 47 | Carsten Heinrichs GER | 50-54 | 1:11:50 | |
| 48 | Devon Currao AUS | 25-29 | 1:11:57 | |
| 49 | Saskia Hahn GER | 25-29 | 1:12:03 | |
| 50 | Andre Holler GER | 35-39 | 1:12:11 |
Or type your name above.
Finish times, Open · Thursday
This chart shows how many athletes finished in each 2.5-minute band, fastest on the left.A field of normal spread: typical 1:33:21, middle half about 1:23:47 to 1:44:45, fastest 10% (green) under 1:15:35.
See the numbers
| Time band | How many | Share |
|---|---|---|
| 55:00 to 57:30 | 2 | 0.2% |
| 57:30 to 1:00:00 | 4 | 0.4% |
| 1:00:00 to 1:02:30 | 2 | 0.2% |
| 1:02:30 to 1:05:00 | 3 | 0.3% |
| 1:05:00 to 1:07:30 | 18 | 1.9% |
| 1:07:30 to 1:10:00 | 16 | 1.7% |
| 1:10:00 to 1:12:30 | 17 | 1.8% |
| 1:12:30 to 1:15:00 | 29 | 3.0% |
| 1:15:00 to 1:17:30 | 29 | 3.0% |
| 1:17:30 to 1:20:00 | 35 | 3.7% |
| 1:20:00 to 1:22:30 | 57 | 6.0% |
| 1:22:30 to 1:25:00 | 50 | 5.3% |
| 1:25:00 to 1:27:30 | 64 | 6.7% |
| 1:27:30 to 1:30:00 | 67 | 7.0% |
| 1:30:00 to 1:32:30 | 56 | 5.9% |
| 1:32:30 to 1:35:00 | 71 | 7.5% |
| 1:35:00 to 1:37:30 | 65 | 6.8% |
| 1:37:30 to 1:40:00 | 39 | 4.1% |
| 1:40:00 to 1:42:30 | 56 | 5.9% |
| 1:42:30 to 1:45:00 | 37 | 3.9% |
| 1:45:00 to 1:47:30 | 30 | 3.2% |
| 1:47:30 to 1:50:00 | 34 | 3.6% |
| 1:50:00 to 1:52:30 | 19 | 2.0% |
| 1:52:30 to 1:55:00 | 25 | 2.6% |
| 1:55:00 to 1:57:30 | 16 | 1.7% |
| 1:57:30 to 2:00:00 | 21 | 2.2% |
| 2:00:00 to 2:02:30 | 6 | 0.6% |
| 2:02:30 to 2:05:00 | 11 | 1.2% |
| 2:05:00 to 2:07:30 | 14 | 1.5% |
| 2:07:30 to 2:10:00 | 9 | 0.9% |
| 2:10:00 to 2:12:30 | 6 | 0.6% |
| 2:12:30 to 2:15:00 | 3 | 0.3% |
| 2:15:00 to 2:17:30 | 9 | 0.9% |
| 2:17:30 to 2:20:00 | 8 | 0.8% |
| 2:20:00 to 2:22:30 | 3 | 0.3% |
| 2:22:30 to 2:25:00 | 4 | 0.4% |
| 2:25:00 to 2:27:30 | 1 | 0.1% |
| 2:27:30 to 2:30:00 | 6 | 0.6% |
| 2:30:00 to 2:32:30 | 0 | 0.0% |
| 2:32:30 to 2:35:00 | 1 | 0.1% |
| 2:35:00 to 2:37:30 | 2 | 0.2% |
| 2:37:30 to 2:40:00 | 0 | 0.0% |
| 2:40:00 to 2:42:30 | 0 | 0.0% |
| 2:42:30 to 2:45:00 | 2 | 0.2% |
| 2:45:00 to 2:47:30 | 1 | 0.1% |
| 2:47:30 to 2:50:00 | 0 | 0.0% |
| 2:50:00 to 2:52:30 | 0 | 0.0% |
| 2:52:30 to 2:55:00 | 0 | 0.0% |
| 2:55:00 to 2:57:30 | 1 | 0.1% |
| 2:57:30 to 3:00:00 | 0 | 0.0% |
| 3:00:00 to 3:02:30 | 0 | 0.0% |
| 3:02:30 to 3:05:00 | 0 | 0.0% |
| 3:05:00 to 3:07:30 | 2 | 0.2% |
How to read
Each bar is how many finished in that time slot, fastest on the left, men and women together. Green is the fastest 10%; the line is the typical finish.
| # | Athlete | Age group | Time | |
|---|---|---|---|---|
| 1 | Renning Elischer GER | 30-34 | 55:36 | |
| 2 | David Steffes LUX | 40-44 | 57:01 | |
| 3 | Federico Maione ITA | 25-29 | 58:48 | |
| 4 | Jonathan Gauer GER | 25-29 | 58:55 | |
| 5 | Julius Filmer GER | 16-24 | 58:58 | |
| 6 | Algot Kullberg SWE | 16-24 | 59:23 | |
| 7 | Gregers Christensen DEN | 35-39 | 1:00:09 | |
| 8 | Anders Borggaard DEN | 35-39 | 1:02:12 | |
| 9 | MICHELE STANCANELLI ITA | 35-39 | 1:02:53 | |
| 10 | Tae-Ung An KOR | 16-24 | 1:03:30 | |
| 11 | Francescopio Sicignano ITA | 16-24 | 1:04:26 | |
| 12 | Mel Treub NED | 25-29 | 1:05:03 | |
| 13 | Johannes Leitner AUT | 30-34 | 1:05:07 | |
| 14 | Gian-Luca Postoy GER | 25-29 | 1:06:00 | |
| 15 | Benjamin Alteheld GER | 45-49 | 1:06:01 | |
| 16 | Philipp Failer GER | 25-29 | 1:06:03 | |
| 17 | Maximilian Wörrle GER | 16-24 | 1:06:06 | |
| 18 | Maximilian Peter GER | 25-29 | 1:06:08 | |
| 19 | Matthias Santner AUT | 35-39 | 1:06:13 | |
| 20 | Ricky Power IRL | 35-39 | 1:06:17 | |
| 21 | Marlou Walther GER | 35-39 | 1:06:21 | |
| 22 | Tomáš Francouz CZE | 16-24 | 1:06:41 | |
| 23 | William Tsilkas CAN | 30-34 | 1:06:54 | |
| 24 | Alexander Heine GER | 25-29 | 1:06:56 | |
| 25 | Benedikt Breimann GER | 35-39 | 1:06:57 | |
| 26 | Matteo Radice ITA | 35-39 | 1:07:04 | |
| 27 | Edgar TAVARES LUX | 35-39 | 1:07:04 | |
| 28 | Michel Mumm GER | 30-34 | 1:07:24 | |
| 29 | Aleksandar Georgiev BUL | 40-44 | 1:07:24 | |
| 30 | Thomas Maschitzke GER | 30-34 | 1:07:45 | |
| 31 | Sidney Torlach GER | 30-34 | 1:07:53 | |
| 32 | Dylan Boocock GBR | 16-24 | 1:08:07 | |
| 33 | Lara Marit Schröter GER | 16-24 | 1:08:09 | |
| 34 | Benjamin Riemer GER | 35-39 | 1:08:10 | |
| 35 | Manuel Haiden AUT | 40-44 | 1:08:16 | |
| 36 | Christian Marino GER | 45-49 | 1:08:25 | |
| 37 | Luis van Rennings GER | 25-29 | 1:08:35 | |
| 38 | Warren Houtaeve BEL | 30-34 | 1:08:40 | |
| 39 | jip van der Kieft NED | 16-24 | 1:08:57 | |
| 40 | Florian Mesaros AUT | 25-29 | 1:09:09 | |
| 41 | Yannik Kottusch GER | 35-39 | 1:09:10 | |
| 42 | Danny Hedegaard DEN | 30-34 | 1:09:27 | |
| 43 | Tobias Zierof GER | 35-39 | 1:09:36 | |
| 44 | Uli Lägler GER | 35-39 | 1:09:37 | |
| 45 | Phillip Huizing GER | 30-34 | 1:09:48 | |
| 46 | Philipp Schäfer GER | 25-29 | 1:10:40 | |
| 47 | Moritz Schrader GER | 16-24 | 1:10:49 | |
| 48 | Anna Katharina Krawczyk GER | 25-29 | 1:10:58 | |
| 49 | Hermann Schäl GER | 25-29 | 1:11:05 | |
| 50 | Dennis de Loos NED | 30-34 | 1:11:09 |
Or type your name above.
Finish times, Open · Friday
This chart shows how many athletes finished in each 2.5-minute band, fastest on the left.A field of normal spread: typical 1:27:25, middle half about 1:17:51 to 1:38:16, fastest 10% (green) under 1:09:32.
See the numbers
| Time band | How many | Share |
|---|---|---|
| 52:30 to 55:00 | 3 | 0.5% |
| 55:00 to 57:30 | 8 | 1.4% |
| 57:30 to 1:00:00 | 8 | 1.4% |
| 1:00:00 to 1:02:30 | 7 | 1.3% |
| 1:02:30 to 1:05:00 | 12 | 2.2% |
| 1:05:00 to 1:07:30 | 9 | 1.6% |
| 1:07:30 to 1:10:00 | 14 | 2.5% |
| 1:10:00 to 1:12:30 | 20 | 3.6% |
| 1:12:30 to 1:15:00 | 22 | 4.0% |
| 1:15:00 to 1:17:30 | 31 | 5.6% |
| 1:17:30 to 1:20:00 | 36 | 6.5% |
| 1:20:00 to 1:22:30 | 30 | 5.4% |
| 1:22:30 to 1:25:00 | 41 | 7.4% |
| 1:25:00 to 1:27:30 | 39 | 7.0% |
| 1:27:30 to 1:30:00 | 30 | 5.4% |
| 1:30:00 to 1:32:30 | 33 | 5.9% |
| 1:32:30 to 1:35:00 | 28 | 5.0% |
| 1:35:00 to 1:37:30 | 39 | 7.0% |
| 1:37:30 to 1:40:00 | 23 | 4.1% |
| 1:40:00 to 1:42:30 | 18 | 3.2% |
| 1:42:30 to 1:45:00 | 15 | 2.7% |
| 1:45:00 to 1:47:30 | 16 | 2.9% |
| 1:47:30 to 1:50:00 | 11 | 2.0% |
| 1:50:00 to 1:52:30 | 7 | 1.3% |
| 1:52:30 to 1:55:00 | 6 | 1.1% |
| 1:55:00 to 1:57:30 | 12 | 2.2% |
| 1:57:30 to 2:00:00 | 8 | 1.4% |
| 2:00:00 to 2:02:30 | 5 | 0.9% |
| 2:02:30 to 2:05:00 | 4 | 0.7% |
| 2:05:00 to 2:07:30 | 3 | 0.5% |
| 2:07:30 to 2:10:00 | 2 | 0.4% |
| 2:10:00 to 2:12:30 | 1 | 0.2% |
| 2:12:30 to 2:15:00 | 4 | 0.7% |
| 2:15:00 to 2:17:30 | 2 | 0.4% |
| 2:17:30 to 2:20:00 | 1 | 0.2% |
| 2:20:00 to 2:22:30 | 1 | 0.2% |
| 2:22:30 to 2:25:00 | 2 | 0.4% |
| 2:25:00 to 2:27:30 | 1 | 0.2% |
| 2:27:30 to 2:30:00 | 0 | 0.0% |
| 2:30:00 to 2:32:30 | 0 | 0.0% |
| 2:32:30 to 2:35:00 | 1 | 0.2% |
| 2:35:00 to 2:37:30 | 0 | 0.0% |
| 2:37:30 to 2:40:00 | 0 | 0.0% |
| 2:40:00 to 2:42:30 | 0 | 0.0% |
| 2:42:30 to 2:45:00 | 1 | 0.2% |
| 2:45:00 to 2:47:30 | 0 | 0.0% |
| 2:47:30 to 2:50:00 | 0 | 0.0% |
| 2:50:00 to 2:52:30 | 0 | 0.0% |
| 2:52:30 to 2:55:00 | 1 | 0.2% |
| 2:55:00 to 2:57:30 | 0 | 0.0% |
| 2:57:30 to 3:00:00 | 1 | 0.2% |
How to read
Each bar is how many finished in that time slot, fastest on the left, men and women together. Green is the fastest 10%; the line is the typical finish.
| # | Athlete | Age group | Time | |
|---|---|---|---|---|
| 1 | Jannik Czapla GER | – | 53:58 | |
| 2 | Frédéric Dubé CAN | – | 54:21 | |
| 3 | Greyson Kilgore USA | – | 54:47 | |
| 4 | Xavier Dufour FRA | – | 55:02 | |
| 5 | Jake Dearden ENG | – | 55:05 | |
| 6 | Julien Coquillaud-Salomon FRA | – | 55:22 | |
| 7 | Alen Ploj SLO | – | 55:29 | |
| 8 | Graham Halliday SCO | – | 55:57 | |
| 9 | Ronan Lindsay IRL | – | 56:03 | |
| 10 | James Kelly AUS | – | 56:53 | |
| 11 | Liam Mccroary SCO | – | 57:05 | |
| 12 | Ryan Douglas CAN | – | 57:58 | |
| 13 | Tanguy Cruz FRA | – | 58:02 | |
| 14 | Jan Nicholas Bauer GER | 30-34 | 58:18 | |
| 15 | Aitor Lizarazu Hormilla ESP | 30-34 | 58:20 | |
| 16 | Stefanie Oswald GER | – | 58:42 | |
| 17 | Julian Fiedler AUT | 30-34 | 58:57 | |
| 18 | Jess Pettrow AUS | – | 58:57 | |
| 19 | Seka Arning GER | – | 59:42 | |
| 20 | Lauren Stockley ENG | – | 1:00:06 | |
| 21 | Augustin FOURNIER FRA | 25-29 | 1:00:09 | |
| 22 | Georgia Stadelmann AUS | – | 1:00:23 | |
| 23 | Gabriella Moriarty ENG | – | 1:00:49 | |
| 24 | Johann Frank GER | 35-39 | 1:01:15 | |
| 25 | Jana Lebenstedt GER | – | 1:01:47 | |
| 26 | Lea Sophie Pommerening GER | – | 1:01:59 | |
| 27 | Zaidane Chitou GER | 25-29 | 1:02:36 | |
| 28 | Gloria Corbetta ITA | – | 1:02:44 | |
| 29 | Charlie Searle ENG | – | 1:02:58 | |
| 30 | Dominik Sauter GER | 25-29 | 1:03:23 | |
| 31 | Luca Oprandi ITA | 30-34 | 1:03:55 | |
| 32 | Benjamin Baumann GER | 35-39 | 1:03:56 | |
| 33 | Manuela Garcia Caparros ESP | – | 1:04:11 | |
| 34 | Alex Guarino ITA | 30-34 | 1:04:25 | |
| 35 | Vanessa Rubio IRL | 16-24 | 1:04:29 | |
| 36 | Robin Bode GER | 35-39 | 1:04:37 | |
| 37 | Lukas Strutzenberger AUT | 30-34 | 1:04:37 | |
| 38 | Ilgvars Jansons LAT | 35-39 | 1:04:56 | |
| 39 | Aki Yoshida JPN | – | 1:05:24 | |
| 40 | Nils Sambill GER | 40-44 | 1:05:51 | |
| 41 | Lucas Krämer GER | 30-34 | 1:05:52 | |
| 42 | Daniel Widjaja SUI | 45-49 | 1:06:15 | |
| 43 | Sabrina Espey GER | 25-29 | 1:06:21 | |
| 44 | Sara Gandola ITA | – | 1:06:25 | |
| 45 | Roberto Villadangos ESP | 30-34 | 1:06:38 | |
| 46 | David Price GBR | 35-39 | 1:06:43 | |
| 47 | Marc Sommerfeld GER | 25-29 | 1:06:44 | |
| 48 | Alice Schürer AUT | – | 1:07:44 | |
| 49 | Chayline Simon GER | 25-29 | 1:07:47 | |
| 50 | Mikkel Christensen DEN | 25-29 | 1:07:50 |
Or type your name above.
Finish times, Open · Saturday
This chart shows how many athletes finished in each 2.5-minute band, fastest on the left.A field of normal spread: typical 1:27:19, middle half about 1:18:18 to 1:39:07, fastest 10% (green) under 1:11:27.
See the numbers
| Time band | How many | Share |
|---|---|---|
| 55:00 to 57:30 | 1 | 0.1% |
| 57:30 to 1:00:00 | 5 | 0.5% |
| 1:00:00 to 1:02:30 | 9 | 0.8% |
| 1:02:30 to 1:05:00 | 6 | 0.5% |
| 1:05:00 to 1:07:30 | 22 | 2.0% |
| 1:07:30 to 1:10:00 | 36 | 3.3% |
| 1:10:00 to 1:12:30 | 48 | 4.4% |
| 1:12:30 to 1:15:00 | 68 | 6.2% |
| 1:15:00 to 1:17:30 | 59 | 5.4% |
| 1:17:30 to 1:20:00 | 67 | 6.1% |
| 1:20:00 to 1:22:30 | 79 | 7.2% |
| 1:22:30 to 1:25:00 | 78 | 7.1% |
| 1:25:00 to 1:27:30 | 81 | 7.4% |
| 1:27:30 to 1:30:00 | 64 | 5.8% |
| 1:30:00 to 1:32:30 | 52 | 4.7% |
| 1:32:30 to 1:35:00 | 58 | 5.3% |
| 1:35:00 to 1:37:30 | 59 | 5.4% |
| 1:37:30 to 1:40:00 | 52 | 4.7% |
| 1:40:00 to 1:42:30 | 32 | 2.9% |
| 1:42:30 to 1:45:00 | 36 | 3.3% |
| 1:45:00 to 1:47:30 | 33 | 3.0% |
| 1:47:30 to 1:50:00 | 25 | 2.3% |
| 1:50:00 to 1:52:30 | 22 | 2.0% |
| 1:52:30 to 1:55:00 | 18 | 1.6% |
| 1:55:00 to 1:57:30 | 16 | 1.5% |
| 1:57:30 to 2:00:00 | 14 | 1.3% |
| 2:00:00 to 2:02:30 | 7 | 0.6% |
| 2:02:30 to 2:05:00 | 10 | 0.9% |
| 2:05:00 to 2:07:30 | 5 | 0.5% |
| 2:07:30 to 2:10:00 | 12 | 1.1% |
| 2:10:00 to 2:12:30 | 3 | 0.3% |
| 2:12:30 to 2:15:00 | 4 | 0.4% |
| 2:15:00 to 2:17:30 | 3 | 0.3% |
| 2:17:30 to 2:20:00 | 6 | 0.5% |
| 2:20:00 to 2:22:30 | 2 | 0.2% |
| 2:22:30 to 2:25:00 | 2 | 0.2% |
| 2:25:00 to 2:27:30 | 1 | 0.1% |
| 2:27:30 to 2:30:00 | 0 | 0.0% |
| 2:30:00 to 2:32:30 | 0 | 0.0% |
| 2:32:30 to 2:35:00 | 0 | 0.0% |
| 2:35:00 to 2:37:30 | 1 | 0.1% |
| 2:37:30 to 2:40:00 | 2 | 0.2% |
| 2:40:00 to 2:42:30 | 0 | 0.0% |
| 2:42:30 to 2:45:00 | 2 | 0.2% |
| 2:45:00 to 2:47:30 | 0 | 0.0% |
| 2:47:30 to 2:50:00 | 0 | 0.0% |
| 2:50:00 to 2:52:30 | 0 | 0.0% |
| 2:52:30 to 2:55:00 | 0 | 0.0% |
| 2:55:00 to 2:57:30 | 0 | 0.0% |
| 2:57:30 to 3:00:00 | 1 | 0.1% |
How to read
Each bar is how many finished in that time slot, fastest on the left, men and women together. Green is the fastest 10%; the line is the typical finish.
| # | Athlete | Age group | Time | |
|---|---|---|---|---|
| 1 | Michael Flynn IRL | 35-39 | 57:08 | |
| 2 | Liam Shallicker GBR | 30-34 | 57:48 | |
| 3 | Fabian Schuster AUT | 30-34 | 59:06 | |
| 4 | Michel Barenschee GER | 25-29 | 59:14 | |
| 5 | Dominik Hofstetter GER | 30-34 | 59:27 | |
| 6 | Dieter Schwarzkopf GER | 35-39 | 59:44 | |
| 7 | Marc Dörfer GER | 35-39 | 1:00:21 | |
| 8 | Alexander Jäger GER | 16-24 | 1:00:25 | |
| 9 | Jan Roggemann GER | 35-39 | 1:01:32 | |
| 10 | Stefan Pump GER | 25-29 | 1:01:41 | |
| 11 | Emre Ergün GER | 30-34 | 1:02:00 | |
| 12 | Kilian Kaps GER | 16-24 | 1:02:07 | |
| 13 | Ole Olesen DEN | 45-49 | 1:02:13 | |
| 14 | Søren Ejsing DEN | 30-34 | 1:02:25 | |
| 15 | Alexander Tscherkaschin GER | 16-24 | 1:02:29 | |
| 16 | Ben Okeke AUT | 25-29 | 1:02:57 | |
| 17 | Dominik Runge GER | 30-34 | 1:03:21 | |
| 18 | Mirco Schmidt GER | 25-29 | 1:03:45 | |
| 19 | Obidike Okeke NGR | 25-29 | 1:04:07 | |
| 20 | Andrii Mavdiuk UKR | 25-29 | 1:04:14 | |
| 21 | Mats Möller GER | 25-29 | 1:04:50 | |
| 22 | Aigars Rozenberg GER | 35-39 | 1:05:19 | |
| 23 | Janick Niederberger SUI | 16-24 | 1:05:33 | |
| 24 | Daniel Hasse GER | 30-34 | 1:05:38 | |
| 25 | Daniel Hübner GER | 35-39 | 1:05:48 | |
| 26 | Daniel Dumschat GER | 25-29 | 1:05:58 | |
| 27 | Augustin Jagustin CRO | 30-34 | 1:06:00 | |
| 28 | Michael Kessler GER | 35-39 | 1:06:04 | |
| 29 | Ali-Jakob Döpke GER | 35-39 | 1:06:07 | |
| 30 | Lennart Decker GER | 16-24 | 1:06:12 | |
| 31 | Kaan Süerdem TUR | 30-34 | 1:06:12 | |
| 32 | Marco Lindt GER | 30-34 | 1:06:15 | |
| 33 | Bjarne Bernstein GER | 16-24 | 1:06:27 | |
| 34 | Joschka Grabb GER | 35-39 | 1:06:36 | |
| 35 | Manuel Moschinger AUT | 45-49 | 1:06:46 | |
| 36 | Tim Kohl GER | 30-34 | 1:06:53 | |
| 37 | Kilian Borjans GER | 30-34 | 1:06:59 | |
| 38 | Florian Fiehl GER | 30-34 | 1:07:06 | |
| 39 | Mikael Nørgaard Pedersen DEN | 40-44 | 1:07:18 | |
| 40 | Christof Oberschelp GER | 30-34 | 1:07:18 | |
| 41 | Felix Heinz GER | 35-39 | 1:07:20 | |
| 42 | René Jäger GER | 40-44 | 1:07:23 | |
| 43 | Nico Kitta GER | 25-29 | 1:07:25 | |
| 44 | Fernando Bos NED | 40-44 | 1:07:31 | |
| 45 | Quinn Mekel NED | 30-34 | 1:07:32 | |
| 46 | Vincent Olding GER | 30-34 | 1:07:35 | |
| 47 | Tom Harring GER | 25-29 | 1:07:39 | |
| 48 | Tristan Schwegler GER | 30-34 | 1:07:44 | |
| 49 | Bela Seiler GER | 25-29 | 1:07:45 | |
| 50 | Maximilian Heinisch GER | 30-34 | 1:07:45 |
Or type your name above.
Finish times, Open · Sunday
This chart shows how many athletes finished in each 2.5-minute band, fastest on the left.A field of normal spread with a long slow tail: typical 1:35:19, middle half about 1:26:40 to 1:48:20, fastest 10% (green) under 1:19:19.
See the numbers
| Time band | How many | Share |
|---|---|---|
| 1:00:00 to 1:02:30 | 1 | 0.1% |
| 1:02:30 to 1:05:00 | 2 | 0.3% |
| 1:05:00 to 1:07:30 | 0 | 0.0% |
| 1:07:30 to 1:10:00 | 3 | 0.4% |
| 1:10:00 to 1:12:30 | 9 | 1.3% |
| 1:12:30 to 1:15:00 | 15 | 2.2% |
| 1:15:00 to 1:17:30 | 17 | 2.5% |
| 1:17:30 to 1:20:00 | 32 | 4.8% |
| 1:20:00 to 1:22:30 | 27 | 4.0% |
| 1:22:30 to 1:25:00 | 34 | 5.1% |
| 1:25:00 to 1:27:30 | 40 | 6.0% |
| 1:27:30 to 1:30:00 | 43 | 6.4% |
| 1:30:00 to 1:32:30 | 53 | 7.9% |
| 1:32:30 to 1:35:00 | 53 | 7.9% |
| 1:35:00 to 1:37:30 | 33 | 4.9% |
| 1:37:30 to 1:40:00 | 36 | 5.4% |
| 1:40:00 to 1:42:30 | 33 | 4.9% |
| 1:42:30 to 1:45:00 | 26 | 3.9% |
| 1:45:00 to 1:47:30 | 32 | 4.8% |
| 1:47:30 to 1:50:00 | 34 | 5.1% |
| 1:50:00 to 1:52:30 | 19 | 2.8% |
| 1:52:30 to 1:55:00 | 19 | 2.8% |
| 1:55:00 to 1:57:30 | 18 | 2.7% |
| 1:57:30 to 2:00:00 | 9 | 1.3% |
| 2:00:00 to 2:02:30 | 6 | 0.9% |
| 2:02:30 to 2:05:00 | 12 | 1.8% |
| 2:05:00 to 2:07:30 | 11 | 1.6% |
| 2:07:30 to 2:10:00 | 4 | 0.6% |
| 2:10:00 to 2:12:30 | 7 | 1.0% |
| 2:12:30 to 2:15:00 | 6 | 0.9% |
| 2:15:00 to 2:17:30 | 6 | 0.9% |
| 2:17:30 to 2:20:00 | 3 | 0.4% |
| 2:20:00 to 2:22:30 | 2 | 0.3% |
| 2:22:30 to 2:25:00 | 3 | 0.4% |
| 2:25:00 to 2:27:30 | 3 | 0.4% |
| 2:27:30 to 2:30:00 | 3 | 0.4% |
| 2:30:00 to 2:32:30 | 4 | 0.6% |
| 2:32:30 to 2:35:00 | 2 | 0.3% |
| 2:35:00 to 2:37:30 | 2 | 0.3% |
| 2:37:30 to 2:40:00 | 0 | 0.0% |
| 2:40:00 to 2:42:30 | 0 | 0.0% |
| 2:42:30 to 2:45:00 | 0 | 0.0% |
| 2:45:00 to 2:47:30 | 2 | 0.3% |
| 2:47:30 to 2:50:00 | 1 | 0.1% |
| 2:50:00 to 2:52:30 | 0 | 0.0% |
| 2:52:30 to 2:55:00 | 0 | 0.0% |
| 2:55:00 to 2:57:30 | 0 | 0.0% |
| 2:57:30 to 3:00:00 | 0 | 0.0% |
| 3:00:00 to 3:02:30 | 1 | 0.1% |
| 3:02:30 to 3:05:00 | 0 | 0.0% |
| 3:05:00 to 3:07:30 | 0 | 0.0% |
| 3:07:30 to 3:10:00 | 0 | 0.0% |
| 3:10:00 to 3:12:30 | 1 | 0.1% |
How to read
Each bar is how many finished in that time slot, fastest on the left, men and women together. Green is the fastest 10%; the line is the typical finish.
| # | Athlete | Age group | Time | |
|---|---|---|---|---|
| 1 | Anna-Lena Schreijäg GER | 30-34 | 1:00:35 | |
| 2 | Johanne Axelsen DEN | 30-34 | 1:03:10 | |
| 3 | Ann-Kathrin Peters GER | 30-34 | 1:03:53 | |
| 4 | Friederike Brose GER | 40-44 | 1:08:03 | |
| 5 | Svenja Remter GER | 25-29 | 1:08:25 | |
| 6 | Carina Opitz GER | 30-34 | 1:09:16 | |
| 7 | Tatu Nodari-Blattner SUI | 35-39 | 1:10:19 | |
| 8 | Linah Keniz GER | 16-24 | 1:10:31 | |
| 9 | Alix Rekersbrink GER | 30-34 | 1:11:15 | |
| 10 | Cathrin Möller GER | 40-44 | 1:11:45 | |
| 11 | Enya Oltersdorf GER | 25-29 | 1:11:50 | |
| 12 | Julia Aland GER | 45-49 | 1:11:50 | |
| 13 | Lynn Erdmann GER | 30-34 | 1:11:58 | |
| 14 | Johanna Depenbusch GER | 30-34 | 1:12:07 | |
| 15 | Ariane Koch GER | 30-34 | 1:12:14 | |
| 16 | Valérie Bleckmann GER | 25-29 | 1:12:44 | |
| 17 | Melissa Lisicki GER | 35-39 | 1:13:09 | |
| 18 | Finja Loges GER | 16-24 | 1:13:15 | |
| 19 | Victoria Bueschler GER | 30-34 | 1:13:15 | |
| 20 | Juliane Hinz GER | 25-29 | 1:13:16 | |
| 21 | Christina Brockmann GER | 40-44 | 1:13:29 | |
| 22 | Birte Hofmann GER | 35-39 | 1:13:44 | |
| 23 | Jacqueline Krzoska GER | 25-29 | 1:13:44 | |
| 24 | Jana Navina Mühlenbrink GER | 35-39 | 1:13:48 | |
| 25 | Lea-Marie Klyk GER | 16-24 | 1:14:05 | |
| 26 | Anna Gregersen DEN | 25-29 | 1:14:33 | |
| 27 | Diana Weber GER | 35-39 | 1:14:43 | |
| 28 | Lucy Bauschulte GER | 25-29 | 1:14:45 | |
| 29 | Fanny Möck GER | 35-39 | 1:14:48 | |
| 30 | Dina Bergmann GER | 35-39 | 1:14:49 | |
| 31 | Louise Gregersen DEN | 45-49 | 1:15:10 | |
| 32 | Christina Schäfer GER | 30-34 | 1:15:33 | |
| 33 | Karoline Gajda GER | 35-39 | 1:15:34 | |
| 34 | Paula Molzahn GER | 25-29 | 1:15:34 | |
| 35 | Sonja Böttcher GER | 30-34 | 1:15:38 | |
| 36 | Benita Forst GER | 25-29 | 1:16:21 | |
| 37 | Merete Eybye Dam DEN | 40-44 | 1:16:21 | |
| 38 | Wiebke Ellmann GER | 16-24 | 1:16:28 | |
| 39 | Alessia Arnaldo ITA | 25-29 | 1:16:32 | |
| 40 | Nathalie Houben GER | 30-34 | 1:16:47 | |
| 41 | Lea Lackner GER | 25-29 | 1:16:54 | |
| 42 | Jana Osterhaus GER | 25-29 | 1:16:55 | |
| 43 | Kateryna Tsilynko UKR | 30-34 | 1:17:01 | |
| 44 | Mirja Huntemüller GER | 40-44 | 1:17:09 | |
| 45 | Pia Terfloth GER | 30-34 | 1:17:12 | |
| 46 | Tatjana Lesmann GER | 25-29 | 1:17:23 | |
| 47 | Martina Schuster GER | 50-54 | 1:17:23 | |
| 48 | Sophie Kral GER | 16-24 | 1:17:33 | |
| 49 | Sina Böger GER | 16-24 | 1:17:33 | |
| 50 | Julia Fleschütz GER | 25-29 | 1:17:42 |
Or type your name above.
Finish times, Doubles · Wednesday
This chart shows how many athletes finished in each 2.5-minute band, fastest on the left.A field of normal spread: typical 1:26:11, middle half about 1:17:31 to 1:36:36, fastest 10% (green) under 1:10:07.
See the numbers
| Time band | How many | Share |
|---|---|---|
| 50:00 to 52:30 | 1 | 0.1% |
| 52:30 to 55:00 | 1 | 0.1% |
| 55:00 to 57:30 | 2 | 0.1% |
| 57:30 to 1:00:00 | 16 | 1.0% |
| 1:00:00 to 1:02:30 | 13 | 0.9% |
| 1:02:30 to 1:05:00 | 25 | 1.6% |
| 1:05:00 to 1:07:30 | 33 | 2.2% |
| 1:07:30 to 1:10:00 | 58 | 3.8% |
| 1:10:00 to 1:12:30 | 57 | 3.7% |
| 1:12:30 to 1:15:00 | 78 | 5.1% |
| 1:15:00 to 1:17:30 | 96 | 6.3% |
| 1:17:30 to 1:20:00 | 112 | 7.3% |
| 1:20:00 to 1:22:30 | 113 | 7.4% |
| 1:22:30 to 1:25:00 | 101 | 6.6% |
| 1:25:00 to 1:27:30 | 105 | 6.9% |
| 1:27:30 to 1:30:00 | 103 | 6.8% |
| 1:30:00 to 1:32:30 | 98 | 6.4% |
| 1:32:30 to 1:35:00 | 78 | 5.1% |
| 1:35:00 to 1:37:30 | 83 | 5.4% |
| 1:37:30 to 1:40:00 | 69 | 4.5% |
| 1:40:00 to 1:42:30 | 54 | 3.5% |
| 1:42:30 to 1:45:00 | 51 | 3.3% |
| 1:45:00 to 1:47:30 | 37 | 2.4% |
| 1:47:30 to 1:50:00 | 35 | 2.3% |
| 1:50:00 to 1:52:30 | 23 | 1.5% |
| 1:52:30 to 1:55:00 | 21 | 1.4% |
| 1:55:00 to 1:57:30 | 10 | 0.7% |
| 1:57:30 to 2:00:00 | 10 | 0.7% |
| 2:00:00 to 2:02:30 | 8 | 0.5% |
| 2:02:30 to 2:05:00 | 8 | 0.5% |
| 2:05:00 to 2:07:30 | 8 | 0.5% |
| 2:07:30 to 2:10:00 | 3 | 0.2% |
| 2:10:00 to 2:12:30 | 5 | 0.3% |
| 2:12:30 to 2:15:00 | 3 | 0.2% |
| 2:15:00 to 2:17:30 | 1 | 0.1% |
| 2:17:30 to 2:20:00 | 1 | 0.1% |
| 2:20:00 to 2:22:30 | 2 | 0.1% |
| 2:22:30 to 2:25:00 | 1 | 0.1% |
| 2:25:00 to 2:27:30 | 0 | 0.0% |
| 2:27:30 to 2:30:00 | 0 | 0.0% |
| 2:30:00 to 2:32:30 | 0 | 0.0% |
| 2:32:30 to 2:35:00 | 0 | 0.0% |
| 2:35:00 to 2:37:30 | 0 | 0.0% |
| 2:37:30 to 2:40:00 | 0 | 0.0% |
| 2:40:00 to 2:42:30 | 0 | 0.0% |
| 2:42:30 to 2:45:00 | 0 | 0.0% |
| 2:45:00 to 2:47:30 | 0 | 0.0% |
| 2:47:30 to 2:50:00 | 0 | 0.0% |
| 2:50:00 to 2:52:30 | 1 | 0.1% |
How to read
Each bar is how many finished in that time slot, fastest on the left, men and women together. Green is the fastest 10%; the line is the typical finish.
Or type your name above.
Finish times, Doubles · Thursday
This chart shows how many athletes finished in each 2.5-minute band, fastest on the left.A field of normal spread: typical 1:24:24, middle half about 1:16:28 to 1:33:25, fastest 10% (green) under 1:09:40.
See the numbers
| Time band | How many | Share |
|---|---|---|
| 50:00 to 52:30 | 1 | 0.1% |
| 52:30 to 55:00 | 1 | 0.1% |
| 55:00 to 57:30 | 3 | 0.2% |
| 57:30 to 1:00:00 | 16 | 1.0% |
| 1:00:00 to 1:02:30 | 13 | 0.8% |
| 1:02:30 to 1:05:00 | 27 | 1.7% |
| 1:05:00 to 1:07:30 | 40 | 2.6% |
| 1:07:30 to 1:10:00 | 64 | 4.1% |
| 1:10:00 to 1:12:30 | 79 | 5.1% |
| 1:12:30 to 1:15:00 | 90 | 5.8% |
| 1:15:00 to 1:17:30 | 96 | 6.2% |
| 1:17:30 to 1:20:00 | 114 | 7.3% |
| 1:20:00 to 1:22:30 | 144 | 9.2% |
| 1:22:30 to 1:25:00 | 125 | 8.0% |
| 1:25:00 to 1:27:30 | 107 | 6.9% |
| 1:27:30 to 1:30:00 | 118 | 7.6% |
| 1:30:00 to 1:32:30 | 99 | 6.3% |
| 1:32:30 to 1:35:00 | 90 | 5.8% |
| 1:35:00 to 1:37:30 | 59 | 3.8% |
| 1:37:30 to 1:40:00 | 59 | 3.8% |
| 1:40:00 to 1:42:30 | 39 | 2.5% |
| 1:42:30 to 1:45:00 | 33 | 2.1% |
| 1:45:00 to 1:47:30 | 29 | 1.9% |
| 1:47:30 to 1:50:00 | 29 | 1.9% |
| 1:50:00 to 1:52:30 | 13 | 0.8% |
| 1:52:30 to 1:55:00 | 17 | 1.1% |
| 1:55:00 to 1:57:30 | 13 | 0.8% |
| 1:57:30 to 2:00:00 | 9 | 0.6% |
| 2:00:00 to 2:02:30 | 6 | 0.4% |
| 2:02:30 to 2:05:00 | 3 | 0.2% |
| 2:05:00 to 2:07:30 | 5 | 0.3% |
| 2:07:30 to 2:10:00 | 3 | 0.2% |
| 2:10:00 to 2:12:30 | 4 | 0.3% |
| 2:12:30 to 2:15:00 | 5 | 0.3% |
| 2:15:00 to 2:17:30 | 2 | 0.1% |
| 2:17:30 to 2:20:00 | 0 | 0.0% |
| 2:20:00 to 2:22:30 | 1 | 0.1% |
| 2:22:30 to 2:25:00 | 1 | 0.1% |
| 2:25:00 to 2:27:30 | 1 | 0.1% |
| 2:27:30 to 2:30:00 | 0 | 0.0% |
| 2:30:00 to 2:32:30 | 0 | 0.0% |
| 2:32:30 to 2:35:00 | 0 | 0.0% |
| 2:35:00 to 2:37:30 | 0 | 0.0% |
| 2:37:30 to 2:40:00 | 1 | 0.1% |
| 2:40:00 to 2:42:30 | 1 | 0.1% |
How to read
Each bar is how many finished in that time slot, fastest on the left, men and women together. Green is the fastest 10%; the line is the typical finish.
Or type your name above.
Finish times, Doubles · Friday
This chart shows how many athletes finished in each 2.5-minute band, fastest on the left.A field of normal spread: typical 1:20:16, middle half about 1:12:34 to 1:30:00, fastest 10% (green) under 1:05:08.
See the numbers
| Time band | How many | Share |
|---|---|---|
| 52:30 to 55:00 | 1 | 0.2% |
| 55:00 to 57:30 | 2 | 0.3% |
| 57:30 to 1:00:00 | 15 | 2.3% |
| 1:00:00 to 1:02:30 | 21 | 3.2% |
| 1:02:30 to 1:05:00 | 23 | 3.5% |
| 1:05:00 to 1:07:30 | 31 | 4.7% |
| 1:07:30 to 1:10:00 | 35 | 5.3% |
| 1:10:00 to 1:12:30 | 36 | 5.5% |
| 1:12:30 to 1:15:00 | 40 | 6.1% |
| 1:15:00 to 1:17:30 | 60 | 9.1% |
| 1:17:30 to 1:20:00 | 62 | 9.4% |
| 1:20:00 to 1:22:30 | 41 | 6.2% |
| 1:22:30 to 1:25:00 | 54 | 8.2% |
| 1:25:00 to 1:27:30 | 43 | 6.5% |
| 1:27:30 to 1:30:00 | 31 | 4.7% |
| 1:30:00 to 1:32:30 | 37 | 5.6% |
| 1:32:30 to 1:35:00 | 32 | 4.8% |
| 1:35:00 to 1:37:30 | 22 | 3.3% |
| 1:37:30 to 1:40:00 | 20 | 3.0% |
| 1:40:00 to 1:42:30 | 10 | 1.5% |
| 1:42:30 to 1:45:00 | 9 | 1.4% |
| 1:45:00 to 1:47:30 | 8 | 1.2% |
| 1:47:30 to 1:50:00 | 8 | 1.2% |
| 1:50:00 to 1:52:30 | 4 | 0.6% |
| 1:52:30 to 1:55:00 | 2 | 0.3% |
| 1:55:00 to 1:57:30 | 4 | 0.6% |
| 1:57:30 to 2:00:00 | 2 | 0.3% |
| 2:00:00 to 2:02:30 | 3 | 0.5% |
| 2:02:30 to 2:05:00 | 2 | 0.3% |
| 2:05:00 to 2:07:30 | 0 | 0.0% |
| 2:07:30 to 2:10:00 | 0 | 0.0% |
| 2:10:00 to 2:12:30 | 0 | 0.0% |
| 2:12:30 to 2:15:00 | 0 | 0.0% |
| 2:15:00 to 2:17:30 | 1 | 0.2% |
| 2:17:30 to 2:20:00 | 0 | 0.0% |
| 2:20:00 to 2:22:30 | 0 | 0.0% |
| 2:22:30 to 2:25:00 | 0 | 0.0% |
| 2:25:00 to 2:27:30 | 0 | 0.0% |
| 2:27:30 to 2:30:00 | 0 | 0.0% |
| 2:30:00 to 2:32:30 | 0 | 0.0% |
| 2:32:30 to 2:35:00 | 0 | 0.0% |
| 2:35:00 to 2:37:30 | 0 | 0.0% |
| 2:37:30 to 2:40:00 | 1 | 0.2% |
How to read
Each bar is how many finished in that time slot, fastest on the left, men and women together. Green is the fastest 10%; the line is the typical finish.
Or type your name above.
Finish times, Doubles · Saturday
This chart shows how many athletes finished in each 2.5-minute band, fastest on the left.A field of normal spread: typical 1:21:27, middle half about 1:13:01 to 1:29:50, fastest 10% (green) under 1:04:50.
See the numbers
| Time band | How many | Share |
|---|---|---|
| 47:30 to 50:00 | 3 | 0.3% |
| 50:00 to 52:30 | 6 | 0.7% |
| 52:30 to 55:00 | 6 | 0.7% |
| 55:00 to 57:30 | 5 | 0.6% |
| 57:30 to 1:00:00 | 17 | 1.9% |
| 1:00:00 to 1:02:30 | 18 | 2.0% |
| 1:02:30 to 1:05:00 | 35 | 4.0% |
| 1:05:00 to 1:07:30 | 22 | 2.5% |
| 1:07:30 to 1:10:00 | 41 | 4.7% |
| 1:10:00 to 1:12:30 | 57 | 6.5% |
| 1:12:30 to 1:15:00 | 49 | 5.6% |
| 1:15:00 to 1:17:30 | 65 | 7.4% |
| 1:17:30 to 1:20:00 | 68 | 7.7% |
| 1:20:00 to 1:22:30 | 79 | 9.0% |
| 1:22:30 to 1:25:00 | 66 | 7.5% |
| 1:25:00 to 1:27:30 | 77 | 8.7% |
| 1:27:30 to 1:30:00 | 50 | 5.7% |
| 1:30:00 to 1:32:30 | 54 | 6.1% |
| 1:32:30 to 1:35:00 | 30 | 3.4% |
| 1:35:00 to 1:37:30 | 26 | 3.0% |
| 1:37:30 to 1:40:00 | 20 | 2.3% |
| 1:40:00 to 1:42:30 | 22 | 2.5% |
| 1:42:30 to 1:45:00 | 12 | 1.4% |
| 1:45:00 to 1:47:30 | 9 | 1.0% |
| 1:47:30 to 1:50:00 | 9 | 1.0% |
| 1:50:00 to 1:52:30 | 6 | 0.7% |
| 1:52:30 to 1:55:00 | 1 | 0.1% |
| 1:55:00 to 1:57:30 | 9 | 1.0% |
| 1:57:30 to 2:00:00 | 7 | 0.8% |
| 2:00:00 to 2:02:30 | 2 | 0.2% |
| 2:02:30 to 2:05:00 | 6 | 0.7% |
| 2:05:00 to 2:07:30 | 2 | 0.2% |
| 2:07:30 to 2:10:00 | 0 | 0.0% |
| 2:10:00 to 2:12:30 | 0 | 0.0% |
| 2:12:30 to 2:15:00 | 0 | 0.0% |
| 2:15:00 to 2:17:30 | 0 | 0.0% |
| 2:17:30 to 2:20:00 | 0 | 0.0% |
| 2:20:00 to 2:22:30 | 1 | 0.1% |
| 2:22:30 to 2:25:00 | 0 | 0.0% |
| 2:25:00 to 2:27:30 | 1 | 0.1% |
How to read
Each bar is how many finished in that time slot, fastest on the left, men and women together. Green is the fastest 10%; the line is the typical finish.
Or type your name above.
Finish times, Doubles · Sunday
This chart shows how many athletes finished in each 2.5-minute band, fastest on the left.A field of normal spread: typical 1:23:19, middle half about 1:15:24 to 1:32:51, fastest 10% (green) under 1:08:13.
See the numbers
| Time band | How many | Share |
|---|---|---|
| 50:00 to 52:30 | 1 | 0.1% |
| 52:30 to 55:00 | 3 | 0.2% |
| 55:00 to 57:30 | 8 | 0.4% |
| 57:30 to 1:00:00 | 22 | 1.2% |
| 1:00:00 to 1:02:30 | 22 | 1.2% |
| 1:02:30 to 1:05:00 | 45 | 2.5% |
| 1:05:00 to 1:07:30 | 62 | 3.4% |
| 1:07:30 to 1:10:00 | 78 | 4.3% |
| 1:10:00 to 1:12:30 | 89 | 4.9% |
| 1:12:30 to 1:15:00 | 102 | 5.6% |
| 1:15:00 to 1:17:30 | 137 | 7.5% |
| 1:17:30 to 1:20:00 | 144 | 7.9% |
| 1:20:00 to 1:22:30 | 138 | 7.6% |
| 1:22:30 to 1:25:00 | 140 | 7.7% |
| 1:25:00 to 1:27:30 | 140 | 7.7% |
| 1:27:30 to 1:30:00 | 113 | 6.2% |
| 1:30:00 to 1:32:30 | 105 | 5.8% |
| 1:32:30 to 1:35:00 | 96 | 5.3% |
| 1:35:00 to 1:37:30 | 81 | 4.5% |
| 1:37:30 to 1:40:00 | 57 | 3.1% |
| 1:40:00 to 1:42:30 | 46 | 2.5% |
| 1:42:30 to 1:45:00 | 44 | 2.4% |
| 1:45:00 to 1:47:30 | 35 | 1.9% |
| 1:47:30 to 1:50:00 | 24 | 1.3% |
| 1:50:00 to 1:52:30 | 20 | 1.1% |
| 1:52:30 to 1:55:00 | 17 | 0.9% |
| 1:55:00 to 1:57:30 | 8 | 0.4% |
| 1:57:30 to 2:00:00 | 6 | 0.3% |
| 2:00:00 to 2:02:30 | 5 | 0.3% |
| 2:02:30 to 2:05:00 | 6 | 0.3% |
| 2:05:00 to 2:07:30 | 7 | 0.4% |
| 2:07:30 to 2:10:00 | 3 | 0.2% |
| 2:10:00 to 2:12:30 | 4 | 0.2% |
| 2:12:30 to 2:15:00 | 3 | 0.2% |
| 2:15:00 to 2:17:30 | 2 | 0.1% |
| 2:17:30 to 2:20:00 | 0 | 0.0% |
| 2:20:00 to 2:22:30 | 0 | 0.0% |
| 2:22:30 to 2:25:00 | 2 | 0.1% |
| 2:25:00 to 2:27:30 | 1 | 0.1% |
| 2:27:30 to 2:30:00 | 0 | 0.0% |
| 2:30:00 to 2:32:30 | 1 | 0.1% |
How to read
Each bar is how many finished in that time slot, fastest on the left, men and women together. Green is the fastest 10%; the line is the typical finish.
Or type your name above.
Finish times, Pro · Friday
This chart shows how many athletes finished in each 2.5-minute band, fastest on the left.A field of normal spread: typical 1:23:55, middle half about 1:13:38 to 1:33:50, fastest 10% (green) under 1:06:04.
See the numbers
| Time band | How many | Share |
|---|---|---|
| 52:30 to 55:00 | 2 | 0.2% |
| 55:00 to 57:30 | 4 | 0.4% |
| 57:30 to 1:00:00 | 15 | 1.6% |
| 1:00:00 to 1:02:30 | 19 | 2.1% |
| 1:02:30 to 1:05:00 | 32 | 3.5% |
| 1:05:00 to 1:07:30 | 34 | 3.7% |
| 1:07:30 to 1:10:00 | 42 | 4.6% |
| 1:10:00 to 1:12:30 | 51 | 5.5% |
| 1:12:30 to 1:15:00 | 68 | 7.4% |
| 1:15:00 to 1:17:30 | 51 | 5.5% |
| 1:17:30 to 1:20:00 | 60 | 6.5% |
| 1:20:00 to 1:22:30 | 51 | 5.5% |
| 1:22:30 to 1:25:00 | 61 | 6.6% |
| 1:25:00 to 1:27:30 | 66 | 7.2% |
| 1:27:30 to 1:30:00 | 59 | 6.4% |
| 1:30:00 to 1:32:30 | 52 | 5.7% |
| 1:32:30 to 1:35:00 | 43 | 4.7% |
| 1:35:00 to 1:37:30 | 33 | 3.6% |
| 1:37:30 to 1:40:00 | 26 | 2.8% |
| 1:40:00 to 1:42:30 | 28 | 3.0% |
| 1:42:30 to 1:45:00 | 16 | 1.7% |
| 1:45:00 to 1:47:30 | 14 | 1.5% |
| 1:47:30 to 1:50:00 | 16 | 1.7% |
| 1:50:00 to 1:52:30 | 13 | 1.4% |
| 1:52:30 to 1:55:00 | 8 | 0.9% |
| 1:55:00 to 1:57:30 | 8 | 0.9% |
| 1:57:30 to 2:00:00 | 8 | 0.9% |
| 2:00:00 to 2:02:30 | 4 | 0.4% |
| 2:02:30 to 2:05:00 | 3 | 0.3% |
| 2:05:00 to 2:07:30 | 7 | 0.8% |
| 2:07:30 to 2:10:00 | 0 | 0.0% |
| 2:10:00 to 2:12:30 | 2 | 0.2% |
| 2:12:30 to 2:15:00 | 3 | 0.3% |
| 2:15:00 to 2:17:30 | 2 | 0.2% |
| 2:17:30 to 2:20:00 | 1 | 0.1% |
| 2:20:00 to 2:22:30 | 0 | 0.0% |
| 2:22:30 to 2:25:00 | 3 | 0.3% |
| 2:25:00 to 2:27:30 | 3 | 0.3% |
| 2:27:30 to 2:30:00 | 5 | 0.5% |
| 2:30:00 to 2:32:30 | 2 | 0.2% |
| 2:32:30 to 2:35:00 | 1 | 0.1% |
| 2:35:00 to 2:37:30 | 0 | 0.0% |
| 2:37:30 to 2:40:00 | 2 | 0.2% |
| 2:40:00 to 2:42:30 | 0 | 0.0% |
| 2:42:30 to 2:45:00 | 2 | 0.2% |
How to read
Each bar is how many finished in that time slot, fastest on the left, men and women together. Green is the fastest 10%; the line is the typical finish.
| # | Athlete | Age group | Time | |
|---|---|---|---|---|
| 1 | Stephen Pelkofer USA | 30-34 | 54:44 | |
| 2 | Sam Schoeman NED | 25-29 | 54:54 | |
| 3 | Pedro Antonio Toral Leiva ESP | 25-29 | 55:15 | |
| 4 | Roberto Viciedo Gimeno ESP | 25-29 | 55:19 | |
| 5 | Tiziano Pedrocchi SUI | 25-29 | 56:47 | |
| 6 | Lukas Wrobel DEN | 25-29 | 57:20 | |
| 7 | Simo Gvero BIH | 30-34 | 58:15 | |
| 8 | Petter Saltvik NOR | 16-24 | 58:28 | |
| 9 | Elias Wieland GER | 16-24 | 58:40 | |
| 10 | Turker Alici DEN | 30-34 | 58:45 | |
| 11 | Vic Vandendaele BEL | 25-29 | 59:02 | |
| 12 | Renning Elischer GER | 30-34 | 59:04 | |
| 13 | Jop Janssen NED | 30-34 | 59:13 | |
| 14 | Paul O brien IRL | 40-44 | 59:14 | |
| 15 | Max Bernard GER | 25-29 | 59:20 | |
| 16 | Thierry Delalonde FRA | 35-39 | 59:26 | |
| 17 | Manuel Ziegler GER | 35-39 | 59:28 | |
| 18 | Enrico Corvetto ITA | 40-44 | 59:30 | |
| 19 | Mathias Lynge DEN | 30-34 | 59:30 | |
| 20 | Jennifer Nikolaus GER | 35-39 | 59:32 | |
| 21 | Ryan Hogan GBR | 35-39 | 59:39 | |
| 22 | Adam Sinclair GBR | 30-34 | 1:00:14 | |
| 23 | Nils David GER | 30-34 | 1:00:15 | |
| 24 | Nico Küttner GER | 30-34 | 1:00:23 | |
| 25 | Victor de la Cruz CUB | 40-44 | 1:00:32 | |
| 26 | Dimitry Martins FRA | 25-29 | 1:00:43 | |
| 27 | MONICA FERRER PASTOR ESP | 35-39 | 1:00:47 | |
| 28 | Tanja Schuck GER | 25-29 | 1:00:51 | |
| 29 | wonjoon Jung KOR | 30-34 | 1:00:58 | |
| 30 | Tobias Schmitt GER | 25-29 | 1:01:07 | |
| 31 | Elte Hupkes NED | 35-39 | 1:01:09 | |
| 32 | Koen Proost NED | 16-24 | 1:01:26 | |
| 33 | Mauro Viel ITA | 45-49 | 1:01:31 | |
| 34 | Milan Konopásek CZE | 16-24 | 1:01:33 | |
| 35 | Kent Aktas NED | 25-29 | 1:01:53 | |
| 36 | Mark Nieuwenhuis NED | 35-39 | 1:01:58 | |
| 37 | Kamil Kozioł POL | 35-39 | 1:02:01 | |
| 38 | Laura Valgreen DEN | 25-29 | 1:02:18 | |
| 39 | Artur Eisenbraun GER | 40-44 | 1:02:26 | |
| 40 | Eddie Bosman NED | 25-29 | 1:02:28 | |
| 41 | Christoph Wieloch GER | 35-39 | 1:02:30 | |
| 42 | Gabriel Lichtenstein GER | 30-34 | 1:02:35 | |
| 43 | Daniel Bejer DEN | 16-24 | 1:02:35 | |
| 44 | Frederik Lundelius DEN | 25-29 | 1:02:36 | |
| 45 | Nils Knuth GER | 16-24 | 1:02:49 | |
| 46 | Fernando Suarez Medina ESP | 25-29 | 1:02:57 | |
| 47 | Kim Brun Nissen DEN | 35-39 | 1:02:58 | |
| 48 | Svenja Sommer GER | 25-29 | 1:03:08 | |
| 49 | Piran Asci GER | 30-34 | 1:03:20 | |
| 50 | Timo Zeilinger AUT | 16-24 | 1:03:28 |
Or type your name above.
Finish times, Pro Doubles · Saturday
This chart shows how many athletes finished in each 2.5-minute band, fastest on the left.A field of normal spread: typical 1:13:31, middle half about 1:04:44 to 1:21:22, fastest 10% (green) under 59:24.
See the numbers
| Time band | How many | Share |
|---|---|---|
| 47:30 to 50:00 | 2 | 0.3% |
| 50:00 to 52:30 | 6 | 0.9% |
| 52:30 to 55:00 | 14 | 2.0% |
| 55:00 to 57:30 | 15 | 2.1% |
| 57:30 to 1:00:00 | 48 | 6.9% |
| 1:00:00 to 1:02:30 | 34 | 4.9% |
| 1:02:30 to 1:05:00 | 62 | 8.9% |
| 1:05:00 to 1:07:30 | 47 | 6.7% |
| 1:07:30 to 1:10:00 | 50 | 7.2% |
| 1:10:00 to 1:12:30 | 47 | 6.7% |
| 1:12:30 to 1:15:00 | 56 | 8.0% |
| 1:15:00 to 1:17:30 | 56 | 8.0% |
| 1:17:30 to 1:20:00 | 62 | 8.9% |
| 1:20:00 to 1:22:30 | 45 | 6.4% |
| 1:22:30 to 1:25:00 | 30 | 4.3% |
| 1:25:00 to 1:27:30 | 17 | 2.4% |
| 1:27:30 to 1:30:00 | 27 | 3.9% |
| 1:30:00 to 1:32:30 | 14 | 2.0% |
| 1:32:30 to 1:35:00 | 12 | 1.7% |
| 1:35:00 to 1:37:30 | 14 | 2.0% |
| 1:37:30 to 1:40:00 | 12 | 1.7% |
| 1:40:00 to 1:42:30 | 1 | 0.1% |
| 1:42:30 to 1:45:00 | 5 | 0.7% |
| 1:45:00 to 1:47:30 | 4 | 0.6% |
| 1:47:30 to 1:50:00 | 5 | 0.7% |
| 1:50:00 to 1:52:30 | 2 | 0.3% |
| 1:52:30 to 1:55:00 | 2 | 0.3% |
| 1:55:00 to 1:57:30 | 1 | 0.1% |
| 1:57:30 to 2:00:00 | 0 | 0.0% |
| 2:00:00 to 2:02:30 | 1 | 0.1% |
| 2:02:30 to 2:05:00 | 1 | 0.1% |
| 2:05:00 to 2:07:30 | 3 | 0.4% |
| 2:07:30 to 2:10:00 | 1 | 0.1% |
| 2:10:00 to 2:12:30 | 0 | 0.0% |
| 2:12:30 to 2:15:00 | 0 | 0.0% |
| 2:15:00 to 2:17:30 | 0 | 0.0% |
| 2:17:30 to 2:20:00 | 1 | 0.1% |
| 2:20:00 to 2:22:30 | 1 | 0.1% |
How to read
Each bar is how many finished in that time slot, fastest on the left, men and women together. Green is the fastest 10%; the line is the typical finish.
Or type your name above.
Finish times, Relay · Friday
This chart shows how many athletes finished in each 2.5-minute band, fastest on the left.A widely spread field: typical 1:18:37, middle half about 1:07:40 to 1:28:34, fastest 10% (green) under 59:19.
See the numbers
| Time band | How many | Share |
|---|---|---|
| 50:00 to 52:30 | 1 | 0.5% |
| 52:30 to 55:00 | 5 | 2.6% |
| 55:00 to 57:30 | 5 | 2.6% |
| 57:30 to 1:00:00 | 15 | 7.9% |
| 1:00:00 to 1:02:30 | 3 | 1.6% |
| 1:02:30 to 1:05:00 | 11 | 5.8% |
| 1:05:00 to 1:07:30 | 7 | 3.7% |
| 1:07:30 to 1:10:00 | 11 | 5.8% |
| 1:10:00 to 1:12:30 | 11 | 5.8% |
| 1:12:30 to 1:15:00 | 6 | 3.1% |
| 1:15:00 to 1:17:30 | 14 | 7.3% |
| 1:17:30 to 1:20:00 | 15 | 7.9% |
| 1:20:00 to 1:22:30 | 8 | 4.2% |
| 1:22:30 to 1:25:00 | 10 | 5.2% |
| 1:25:00 to 1:27:30 | 14 | 7.3% |
| 1:27:30 to 1:30:00 | 17 | 8.9% |
| 1:30:00 to 1:32:30 | 11 | 5.8% |
| 1:32:30 to 1:35:00 | 8 | 4.2% |
| 1:35:00 to 1:37:30 | 3 | 1.6% |
| 1:37:30 to 1:40:00 | 5 | 2.6% |
| 1:40:00 to 1:42:30 | 2 | 1.0% |
| 1:42:30 to 1:45:00 | 2 | 1.0% |
| 1:45:00 to 1:47:30 | 3 | 1.6% |
| 1:47:30 to 1:50:00 | 2 | 1.0% |
| 1:50:00 to 1:52:30 | 1 | 0.5% |
| 1:52:30 to 1:55:00 | 1 | 0.5% |
How to read
Each bar is how many finished in that time slot, fastest on the left, men and women together. Green is the fastest 10%; the line is the typical finish.
Or type your name above.
3 finishers in so far: too few for a typical time, so here is the list.
| # | Athlete | Age group | Time | |
|---|---|---|---|---|
| 1 | Vanessa Erskine-Sadler GER | Seated Without Core Function | 1:12:43 | |
| 2 | Erich Stolle GER | Neurological Minor | 1:18:02 | |
| 3 | Johanna Kuss CHI | Neurological Minor | 1:42:58 |
3 finishers in so far: too few for a typical time, so here is the list.
| # | Athlete | Age group | Time | |
|---|---|---|---|---|
| 1 | Jan Hensiek GER | Seated Without Core Function | 1:17:55 | |
| 2 | Marvin Röcher GER | Seated With Hip Function | 1:21:02 | |
| 3 | Timm Richter GER | Deaf Impairment | 2:01:00 |
5 finishers in so far: too few for a typical time, so here is the list.
| # | Athlete | Age group | Time | |
|---|---|---|---|---|
| 1 | Tina Multhaupt GER | Neurological Minor | 59:04 | |
| 2 | Franca Frey GER | Seated Without Hip Function | 1:08:17 | |
| 3 | Ricarda Drobig GER | Seated With Hip Function | 1:26:35 | |
| 4 | Katharina Rüsbüldt GER | Lower Limb Major | 2:06:31 | |
| 5 | Anna-Sophia Schubert GER | Lower Limb Minor | 2:09:38 |
Finish times, Elite Doubles · Saturday
This chart shows how many athletes finished in each 2.5-minute band, fastest on the left.A tightly bunched field with a long slow tail: typical 52:27, middle half about 50:38 to 56:45, fastest 10% (green) under 49:15.
See the numbers
| Time band | How many | Share |
|---|---|---|
| 47:30 to 50:00 | 5 | 16.7% |
| 50:00 to 52:30 | 10 | 33.3% |
| 52:30 to 55:00 | 4 | 13.3% |
| 55:00 to 57:30 | 5 | 16.7% |
| 57:30 to 1:00:00 | 4 | 13.3% |
| 1:00:00 to 1:02:30 | 2 | 6.7% |
How to read
Each bar is how many finished in that time slot, fastest on the left. Green is the fastest 10%; the line is the typical finish.
Finish times, Elite 15 · Friday
This chart shows how many athletes finished in each 2.5-minute band, fastest on the left.A tightly bunched field: typical 57:42, middle half about 55:11 to 1:00:09, fastest 10% (green) under 53:44.
See the numbers
| Time band | How many | Share |
|---|---|---|
| 52:30 to 55:00 | 7 | 23.3% |
| 55:00 to 57:30 | 7 | 23.3% |
| 57:30 to 1:00:00 | 8 | 26.7% |
| 1:00:00 to 1:02:30 | 8 | 26.7% |
How to read
Each bar is how many finished in that time slot, fastest on the left. Green is the fastest 10%; the line is the typical finish.
| # | Athlete | Age group | Time | |
|---|---|---|---|---|
| 1 | Sean Noble IRL | 53:19 | ||
| 2 | Luke Greer ENG | 53:21 | ||
| 3 | Hidde Weersma NED | 53:41 | ||
| 4 | Cole Learn CAN | 53:44 | ||
| 5 | Alexander Roncevic AUT | 54:25 | ||
| 6 | Louis Osselaer BEL | 54:34 | ||
| 7 | Dexter Buchanan NZL | 54:46 | ||
| 8 | Tomas Tvrdik CZE | 55:09 | ||
| 9 | Pelayo Menendez Fernandez ESP | 55:20 | ||
| 10 | Sebastian Ifversen DEN | 55:46 | ||
| 11 | Joanna Wietrzyk AUS | 56:10 | ||
| 12 | Dylan Scott USA | 56:23 | ||
| 13 | Lauren Weeks USA | 56:25 | ||
| 14 | Gabriel Heck USA | 56:26 | ||
| 15 | Tim Wenisch GER | 57:30 | ||
| 16 | Jack Driscoll USA | 57:53 | ||
| 17 | Vivian Tafuto USA | 57:55 | ||
| 18 | Lena Putters BEL | 58:50 | ||
| 19 | Charlie Botterill ENG | 59:16 | ||
| 20 | Danél Louw RSA | 59:17 | ||
| 21 | Annie Emilsson SWE | 59:31 | ||
| 22 | Rachael Wade USA | 59:40 | ||
| 23 | Gabrielle Nikora-Baker NZL | 1:00:02 | ||
| 24 | Alyssa Mcelheny USA | 1:00:24 | ||
| 25 | Calypso Sheridan AUS | 1:00:50 | ||
| 26 | Elli Stenfors FIN | 1:00:52 | ||
| 27 | Saskia Millard ENG | 1:01:04 | ||
| 28 | Tanja Stroschneider AUT | 1:01:11 | ||
| 29 | Camilla Massa ITA | 1:01:21 | ||
| 30 | Melanie Maurer SUI | 1:02:08 |
The times to beat at Hamburg
This chart shows how many athletes finished in each 2.5-minute band, fastest on the left.A field of normal spread: typical 1:28:05, middle half about 1:18:06 to 1:39:31, fastest 10% (green) under 1:11:11.The marked line is fastest 25%: 1:18:06. The busiest band was 1:27:30 to 1:30:00.
See the numbers
| Time band | How many | Share |
|---|---|---|
| 55:00 to 57:30 | 1 | 0.1% |
| 57:30 to 1:00:00 | 2 | 0.1% |
| 1:00:00 to 1:02:30 | 16 | 0.8% |
| 1:02:30 to 1:05:00 | 27 | 1.4% |
| 1:05:00 to 1:07:30 | 34 | 1.8% |
| 1:07:30 to 1:10:00 | 77 | 4.1% |
| 1:10:00 to 1:12:30 | 65 | 3.4% |
| 1:12:30 to 1:15:00 | 121 | 6.4% |
| 1:15:00 to 1:17:30 | 102 | 5.4% |
| 1:17:30 to 1:20:00 | 119 | 6.3% |
| 1:20:00 to 1:22:30 | 106 | 5.6% |
| 1:22:30 to 1:25:00 | 131 | 6.9% |
| 1:25:00 to 1:27:30 | 113 | 6.0% |
| 1:27:30 to 1:30:00 | 142 | 7.5% |
| 1:30:00 to 1:32:30 | 108 | 5.7% |
| 1:32:30 to 1:35:00 | 104 | 5.5% |
| 1:35:00 to 1:37:30 | 99 | 5.2% |
| 1:37:30 to 1:40:00 | 67 | 3.5% |
| 1:40:00 to 1:42:30 | 81 | 4.3% |
| 1:42:30 to 1:45:00 | 65 | 3.4% |
| 1:45:00 to 1:47:30 | 48 | 2.5% |
| 1:47:30 to 1:50:00 | 45 | 2.4% |
| 1:50:00 to 1:52:30 | 29 | 1.5% |
| 1:52:30 to 1:55:00 | 41 | 2.2% |
| 1:55:00 to 1:57:30 | 32 | 1.7% |
| 1:57:30 to 2:00:00 | 24 | 1.3% |
| 2:00:00 to 2:02:30 | 16 | 0.8% |
| 2:02:30 to 2:05:00 | 16 | 0.8% |
| 2:05:00 to 2:07:30 | 10 | 0.5% |
| 2:07:30 to 2:10:00 | 8 | 0.4% |
| 2:10:00 to 2:12:30 | 6 | 0.3% |
| 2:12:30 to 2:15:00 | 8 | 0.4% |
| 2:15:00 to 2:17:30 | 10 | 0.5% |
| 2:17:30 to 2:20:00 | 0 | 0.0% |
| 2:20:00 to 2:22:30 | 0 | 0.0% |
| 2:22:30 to 2:25:00 | 1 | 0.1% |
| 2:25:00 to 2:27:30 | 4 | 0.2% |
| 2:27:30 to 2:30:00 | 4 | 0.2% |
| 2:30:00 to 2:32:30 | 2 | 0.1% |
| 2:32:30 to 2:35:00 | 1 | 0.1% |
| 2:35:00 to 2:37:30 | 3 | 0.2% |
| 2:37:30 to 2:40:00 | 0 | 0.0% |
| 2:40:00 to 2:42:30 | 1 | 0.1% |
| 2:42:30 to 2:45:00 | 2 | 0.1% |
| 2:45:00 to 2:47:30 | 1 | 0.1% |
| 2:47:30 to 2:50:00 | 0 | 0.0% |
| 2:50:00 to 2:52:30 | 0 | 0.0% |
| 2:52:30 to 2:55:00 | 0 | 0.0% |
| 2:55:00 to 2:57:30 | 1 | 0.1% |
| 2:57:30 to 3:00:00 | 0 | 0.0% |
| 3:00:00 to 3:02:30 | 2 | 0.1% |
This chart shows how many athletes finished in each 2.5-minute band, fastest on the left.A field of normal spread: typical 1:32:05, middle half about 1:23:16 to 1:43:05, fastest 10% (green) under 1:15:49.The marked line is fastest 25%: 1:23:17. The busiest band was 1:27:30 to 1:30:00.
See the numbers
| Time band | How many | Share |
|---|---|---|
| 1:00:00 to 1:02:30 | 1 | 0.1% |
| 1:02:30 to 1:05:00 | 5 | 0.6% |
| 1:05:00 to 1:07:30 | 7 | 0.8% |
| 1:07:30 to 1:10:00 | 13 | 1.4% |
| 1:10:00 to 1:12:30 | 23 | 2.6% |
| 1:12:30 to 1:15:00 | 26 | 2.9% |
| 1:15:00 to 1:17:30 | 45 | 5.0% |
| 1:17:30 to 1:20:00 | 46 | 5.1% |
| 1:20:00 to 1:22:30 | 41 | 4.6% |
| 1:22:30 to 1:25:00 | 59 | 6.5% |
| 1:25:00 to 1:27:30 | 69 | 7.7% |
| 1:27:30 to 1:30:00 | 71 | 7.9% |
| 1:30:00 to 1:32:30 | 57 | 6.3% |
| 1:32:30 to 1:35:00 | 57 | 6.3% |
| 1:35:00 to 1:37:30 | 53 | 5.9% |
| 1:37:30 to 1:40:00 | 50 | 5.5% |
| 1:40:00 to 1:42:30 | 43 | 4.8% |
| 1:42:30 to 1:45:00 | 42 | 4.7% |
| 1:45:00 to 1:47:30 | 37 | 4.1% |
| 1:47:30 to 1:50:00 | 32 | 3.6% |
| 1:50:00 to 1:52:30 | 30 | 3.3% |
| 1:52:30 to 1:55:00 | 23 | 2.6% |
| 1:55:00 to 1:57:30 | 11 | 1.2% |
| 1:57:30 to 2:00:00 | 7 | 0.8% |
| 2:00:00 to 2:02:30 | 9 | 1.0% |
| 2:02:30 to 2:05:00 | 11 | 1.2% |
| 2:05:00 to 2:07:30 | 7 | 0.8% |
| 2:07:30 to 2:10:00 | 5 | 0.6% |
| 2:10:00 to 2:12:30 | 4 | 0.4% |
| 2:12:30 to 2:15:00 | 4 | 0.4% |
| 2:15:00 to 2:17:30 | 4 | 0.4% |
| 2:17:30 to 2:20:00 | 1 | 0.1% |
| 2:20:00 to 2:22:30 | 4 | 0.4% |
| 2:22:30 to 2:25:00 | 0 | 0.0% |
| 2:25:00 to 2:27:30 | 0 | 0.0% |
| 2:27:30 to 2:30:00 | 1 | 0.1% |
| 2:30:00 to 2:32:30 | 0 | 0.0% |
| 2:32:30 to 2:35:00 | 0 | 0.0% |
| 2:35:00 to 2:37:30 | 0 | 0.0% |
| 2:37:30 to 2:40:00 | 0 | 0.0% |
| 2:40:00 to 2:42:30 | 0 | 0.0% |
| 2:42:30 to 2:45:00 | 0 | 0.0% |
| 2:45:00 to 2:47:30 | 0 | 0.0% |
| 2:47:30 to 2:50:00 | 0 | 0.0% |
| 2:50:00 to 2:52:30 | 0 | 0.0% |
| 2:52:30 to 2:55:00 | 2 | 0.2% |
| 2:55:00 to 2:57:30 | 0 | 0.0% |
| 2:57:30 to 3:00:00 | 0 | 0.0% |
| 3:00:00 to 3:02:30 | 0 | 0.0% |
| 3:02:30 to 3:05:00 | 1 | 0.1% |
This chart shows how many athletes finished in each 2.5-minute band, fastest on the left.A field of normal spread: typical 1:15:47, middle half about 1:09:20 to 1:24:27, fastest 10% (green) under 1:04:41.The marked line is fastest 25%: 1:09:15. The busiest band was 1:12:30 to 1:15:00.
See the numbers
| Time band | How many | Share |
|---|---|---|
| 52:30 to 55:00 | 2 | 0.2% |
| 55:00 to 57:30 | 9 | 0.8% |
| 57:30 to 1:00:00 | 27 | 2.3% |
| 1:00:00 to 1:02:30 | 32 | 2.7% |
| 1:02:30 to 1:05:00 | 58 | 4.9% |
| 1:05:00 to 1:07:30 | 84 | 7.1% |
| 1:07:30 to 1:10:00 | 117 | 9.8% |
| 1:10:00 to 1:12:30 | 103 | 8.6% |
| 1:12:30 to 1:15:00 | 126 | 10.6% |
| 1:15:00 to 1:17:30 | 103 | 8.6% |
| 1:17:30 to 1:20:00 | 96 | 8.1% |
| 1:20:00 to 1:22:30 | 71 | 6.0% |
| 1:22:30 to 1:25:00 | 84 | 7.1% |
| 1:25:00 to 1:27:30 | 58 | 4.9% |
| 1:27:30 to 1:30:00 | 59 | 5.0% |
| 1:30:00 to 1:32:30 | 32 | 2.7% |
| 1:32:30 to 1:35:00 | 29 | 2.4% |
| 1:35:00 to 1:37:30 | 26 | 2.2% |
| 1:37:30 to 1:40:00 | 16 | 1.3% |
| 1:40:00 to 1:42:30 | 14 | 1.2% |
| 1:42:30 to 1:45:00 | 10 | 0.8% |
| 1:45:00 to 1:47:30 | 6 | 0.5% |
| 1:47:30 to 1:50:00 | 5 | 0.4% |
| 1:50:00 to 1:52:30 | 9 | 0.8% |
| 1:52:30 to 1:55:00 | 3 | 0.3% |
| 1:55:00 to 1:57:30 | 1 | 0.1% |
| 1:57:30 to 2:00:00 | 1 | 0.1% |
| 2:00:00 to 2:02:30 | 1 | 0.1% |
| 2:02:30 to 2:05:00 | 1 | 0.1% |
| 2:05:00 to 2:07:30 | 1 | 0.1% |
| 2:07:30 to 2:10:00 | 2 | 0.2% |
| 2:10:00 to 2:12:30 | 3 | 0.3% |
| 2:12:30 to 2:15:00 | 2 | 0.2% |
This chart shows how many athletes finished in each 2.5-minute band, fastest on the left.A field of normal spread: typical 1:26:36, middle half about 1:19:43 to 1:35:43, fastest 10% (green) under 1:13:19.The marked line is fastest 25%: 1:19:42. The busiest band was 1:25:00 to 1:27:30.
See the numbers
| Time band | How many | Share |
|---|---|---|
| 1:00:00 to 1:02:30 | 3 | 0.3% |
| 1:02:30 to 1:05:00 | 6 | 0.5% |
| 1:05:00 to 1:07:30 | 18 | 1.5% |
| 1:07:30 to 1:10:00 | 23 | 2.0% |
| 1:10:00 to 1:12:30 | 52 | 4.5% |
| 1:12:30 to 1:15:00 | 50 | 4.3% |
| 1:15:00 to 1:17:30 | 63 | 5.4% |
| 1:17:30 to 1:20:00 | 86 | 7.4% |
| 1:20:00 to 1:22:30 | 104 | 8.9% |
| 1:22:30 to 1:25:00 | 107 | 9.2% |
| 1:25:00 to 1:27:30 | 108 | 9.3% |
| 1:27:30 to 1:30:00 | 107 | 9.2% |
| 1:30:00 to 1:32:30 | 71 | 6.1% |
| 1:32:30 to 1:35:00 | 62 | 5.3% |
| 1:35:00 to 1:37:30 | 48 | 4.1% |
| 1:37:30 to 1:40:00 | 45 | 3.9% |
| 1:40:00 to 1:42:30 | 54 | 4.6% |
| 1:42:30 to 1:45:00 | 37 | 3.2% |
| 1:45:00 to 1:47:30 | 33 | 2.8% |
| 1:47:30 to 1:50:00 | 13 | 1.1% |
| 1:50:00 to 1:52:30 | 22 | 1.9% |
| 1:52:30 to 1:55:00 | 14 | 1.2% |
| 1:55:00 to 1:57:30 | 11 | 0.9% |
| 1:57:30 to 2:00:00 | 8 | 0.7% |
| 2:00:00 to 2:02:30 | 7 | 0.6% |
| 2:02:30 to 2:05:00 | 2 | 0.2% |
| 2:05:00 to 2:07:30 | 3 | 0.3% |
| 2:07:30 to 2:10:00 | 1 | 0.1% |
| 2:10:00 to 2:12:30 | 2 | 0.2% |
| 2:12:30 to 2:15:00 | 1 | 0.1% |
| 2:15:00 to 2:17:30 | 0 | 0.0% |
| 2:17:30 to 2:20:00 | 1 | 0.1% |
| 2:20:00 to 2:22:30 | 0 | 0.0% |
| 2:22:30 to 2:25:00 | 1 | 0.1% |
| 2:25:00 to 2:27:30 | 0 | 0.0% |
| 2:27:30 to 2:30:00 | 1 | 0.1% |
| 2:30:00 to 2:32:30 | 1 | 0.1% |
This chart shows how many athletes finished in each 2.5-minute band, fastest on the left.A field of normal spread: typical 1:21:20, middle half about 1:14:09 to 1:30:43, fastest 10% (green) under 1:08:17.The marked line is fastest 25%: 1:13:57. The busiest band was 1:20:00 to 1:22:30.
See the numbers
| Time band | How many | Share |
|---|---|---|
| 52:30 to 55:00 | 1 | 0.1% |
| 55:00 to 57:30 | 6 | 0.6% |
| 57:30 to 1:00:00 | 9 | 0.9% |
| 1:00:00 to 1:02:30 | 21 | 2.0% |
| 1:02:30 to 1:05:00 | 24 | 2.3% |
| 1:05:00 to 1:07:30 | 31 | 3.0% |
| 1:07:30 to 1:10:00 | 45 | 4.3% |
| 1:10:00 to 1:12:30 | 68 | 6.5% |
| 1:12:30 to 1:15:00 | 87 | 8.3% |
| 1:15:00 to 1:17:30 | 85 | 8.1% |
| 1:17:30 to 1:20:00 | 93 | 8.9% |
| 1:20:00 to 1:22:30 | 101 | 9.6% |
| 1:22:30 to 1:25:00 | 75 | 7.1% |
| 1:25:00 to 1:27:30 | 58 | 5.5% |
| 1:27:30 to 1:30:00 | 68 | 6.5% |
| 1:30:00 to 1:32:30 | 54 | 5.1% |
| 1:32:30 to 1:35:00 | 33 | 3.1% |
| 1:35:00 to 1:37:30 | 40 | 3.8% |
| 1:37:30 to 1:40:00 | 29 | 2.8% |
| 1:40:00 to 1:42:30 | 29 | 2.8% |
| 1:42:30 to 1:45:00 | 13 | 1.2% |
| 1:45:00 to 1:47:30 | 20 | 1.9% |
| 1:47:30 to 1:50:00 | 13 | 1.2% |
| 1:50:00 to 1:52:30 | 7 | 0.7% |
| 1:52:30 to 1:55:00 | 9 | 0.9% |
| 1:55:00 to 1:57:30 | 3 | 0.3% |
| 1:57:30 to 2:00:00 | 4 | 0.4% |
| 2:00:00 to 2:02:30 | 5 | 0.5% |
| 2:02:30 to 2:05:00 | 7 | 0.7% |
| 2:05:00 to 2:07:30 | 5 | 0.5% |
| 2:07:30 to 2:10:00 | 2 | 0.2% |
| 2:10:00 to 2:12:30 | 0 | 0.0% |
| 2:12:30 to 2:15:00 | 2 | 0.2% |
| 2:15:00 to 2:17:30 | 0 | 0.0% |
| 2:17:30 to 2:20:00 | 1 | 0.1% |
| 2:20:00 to 2:22:30 | 0 | 0.0% |
| 2:22:30 to 2:25:00 | 0 | 0.0% |
| 2:25:00 to 2:27:30 | 0 | 0.0% |
| 2:27:30 to 2:30:00 | 0 | 0.0% |
| 2:30:00 to 2:32:30 | 1 | 0.1% |
| 2:32:30 to 2:35:00 | 1 | 0.1% |
This chart shows how many athletes finished in each 2.5-minute band, fastest on the left.A field of normal spread: typical 1:19:27, middle half about 1:10:51 to 1:28:05, fastest 10% (green) under 1:04:20.The marked line is fastest 25%: 1:11:33. The busiest band was 1:15:00 to 1:17:30.
See the numbers
| Time band | How many | Share |
|---|---|---|
| 55:00 to 57:30 | 5 | 1.5% |
| 57:30 to 1:00:00 | 8 | 2.4% |
| 1:00:00 to 1:02:30 | 8 | 2.4% |
| 1:02:30 to 1:05:00 | 13 | 4.0% |
| 1:05:00 to 1:07:30 | 17 | 5.2% |
| 1:07:30 to 1:10:00 | 25 | 7.6% |
| 1:10:00 to 1:12:30 | 17 | 5.2% |
| 1:12:30 to 1:15:00 | 24 | 7.3% |
| 1:15:00 to 1:17:30 | 29 | 8.9% |
| 1:17:30 to 1:20:00 | 27 | 8.3% |
| 1:20:00 to 1:22:30 | 20 | 6.1% |
| 1:22:30 to 1:25:00 | 28 | 8.6% |
| 1:25:00 to 1:27:30 | 20 | 6.1% |
| 1:27:30 to 1:30:00 | 18 | 5.5% |
| 1:30:00 to 1:32:30 | 15 | 4.6% |
| 1:32:30 to 1:35:00 | 12 | 3.7% |
| 1:35:00 to 1:37:30 | 10 | 3.1% |
| 1:37:30 to 1:40:00 | 10 | 3.1% |
| 1:40:00 to 1:42:30 | 4 | 1.2% |
| 1:42:30 to 1:45:00 | 4 | 1.2% |
| 1:45:00 to 1:47:30 | 2 | 0.6% |
| 1:47:30 to 1:50:00 | 2 | 0.6% |
| 1:50:00 to 1:52:30 | 1 | 0.3% |
| 1:52:30 to 1:55:00 | 1 | 0.3% |
| 1:55:00 to 1:57:30 | 1 | 0.3% |
| 1:57:30 to 2:00:00 | 1 | 0.3% |
| 2:00:00 to 2:02:30 | 0 | 0.0% |
| 2:02:30 to 2:05:00 | 0 | 0.0% |
| 2:05:00 to 2:07:30 | 1 | 0.3% |
| 2:07:30 to 2:10:00 | 0 | 0.0% |
| 2:10:00 to 2:12:30 | 2 | 0.6% |
| 2:12:30 to 2:15:00 | 1 | 0.3% |
| 2:15:00 to 2:17:30 | 1 | 0.3% |
This chart shows how many athletes finished in each 2.5-minute band, fastest on the left.A field of normal spread: typical 1:24:46, middle half about 1:14:48 to 1:33:04, fastest 10% (green) under 1:09:16.The marked line is fastest 25%: 1:14:50. The busiest band was 1:22:30 to 1:25:00.
See the numbers
| Time band | How many | Share |
|---|---|---|
| 1:00:00 to 1:02:30 | 5 | 2.5% |
| 1:02:30 to 1:05:00 | 3 | 1.5% |
| 1:05:00 to 1:07:30 | 7 | 3.4% |
| 1:07:30 to 1:10:00 | 9 | 4.4% |
| 1:10:00 to 1:12:30 | 12 | 5.9% |
| 1:12:30 to 1:15:00 | 16 | 7.9% |
| 1:15:00 to 1:17:30 | 12 | 5.9% |
| 1:17:30 to 1:20:00 | 10 | 4.9% |
| 1:20:00 to 1:22:30 | 11 | 5.4% |
| 1:22:30 to 1:25:00 | 18 | 8.9% |
| 1:25:00 to 1:27:30 | 17 | 8.4% |
| 1:27:30 to 1:30:00 | 17 | 8.4% |
| 1:30:00 to 1:32:30 | 13 | 6.4% |
| 1:32:30 to 1:35:00 | 10 | 4.9% |
| 1:35:00 to 1:37:30 | 10 | 4.9% |
| 1:37:30 to 1:40:00 | 5 | 2.5% |
| 1:40:00 to 1:42:30 | 4 | 2.0% |
| 1:42:30 to 1:45:00 | 4 | 2.0% |
| 1:45:00 to 1:47:30 | 4 | 2.0% |
| 1:47:30 to 1:50:00 | 3 | 1.5% |
| 1:50:00 to 1:52:30 | 3 | 1.5% |
| 1:52:30 to 1:55:00 | 1 | 0.5% |
| 1:55:00 to 1:57:30 | 4 | 2.0% |
| 1:57:30 to 2:00:00 | 1 | 0.5% |
| 2:00:00 to 2:02:30 | 0 | 0.0% |
| 2:02:30 to 2:05:00 | 1 | 0.5% |
| 2:05:00 to 2:07:30 | 2 | 1.0% |
| 2:07:30 to 2:10:00 | 0 | 0.0% |
| 2:10:00 to 2:12:30 | 0 | 0.0% |
| 2:12:30 to 2:15:00 | 0 | 0.0% |
| 2:15:00 to 2:17:30 | 0 | 0.0% |
| 2:17:30 to 2:20:00 | 1 | 0.5% |
Course notes
- Running was 48% of the typical finish: normal. Your splits compare cleanly with other races.
- The fastest 25% gained most on the runs; of the stations, wall balls.
Before you go
Raced Hamburg? Train for your next race and beat this time.
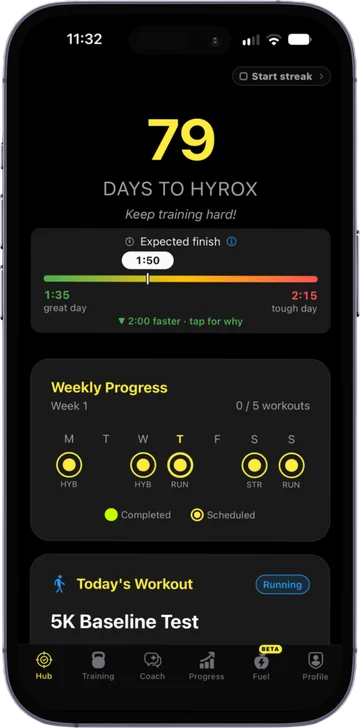
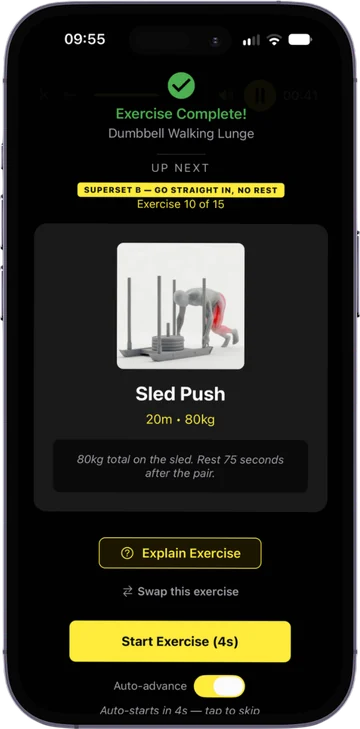
The RoxHype app is your training plan to race day: built from your splits, your kit and your race date, and adjusted every week.
- A week-by-week plan that counts down to your race
- Extra work on your slowest stations
- Adjusts every week to what you actually did
Free to download. Used by more than 40,000 HYROX athletes.