

HYROX Birmingham 2026 results
18,755 finishes so far. Find your name for your race report.
18,755 of the 18,756 results published so far are in. The rest load over the next runs.
Find your result
| Race day | # | Athlete | Age group | Time |
|---|
Provisional lists, by race day. Tap your name for your full race report.
Pick your race day
Finish times, Open · Tuesday
This chart shows how many athletes finished in each 2.5-minute band, fastest on the left.A widely spread field with a long slow tail: typical 1:27:32, middle half about 1:17:13 to 1:40:40, fastest 10% (green) under 1:09:22.
See the numbers
| Time band | How many | Share |
|---|---|---|
| 52:30 to 55:00 | 1 | 0.1% |
| 55:00 to 57:30 | 4 | 0.3% |
| 57:30 to 1:00:00 | 7 | 0.6% |
| 1:00:00 to 1:02:30 | 16 | 1.3% |
| 1:02:30 to 1:05:00 | 26 | 2.1% |
| 1:05:00 to 1:07:30 | 34 | 2.8% |
| 1:07:30 to 1:10:00 | 43 | 3.5% |
| 1:10:00 to 1:12:30 | 63 | 5.2% |
| 1:12:30 to 1:15:00 | 50 | 4.1% |
| 1:15:00 to 1:17:30 | 69 | 5.7% |
| 1:17:30 to 1:20:00 | 61 | 5.0% |
| 1:20:00 to 1:22:30 | 64 | 5.2% |
| 1:22:30 to 1:25:00 | 80 | 6.6% |
| 1:25:00 to 1:27:30 | 90 | 7.4% |
| 1:27:30 to 1:30:00 | 87 | 7.1% |
| 1:30:00 to 1:32:30 | 64 | 5.2% |
| 1:32:30 to 1:35:00 | 59 | 4.8% |
| 1:35:00 to 1:37:30 | 45 | 3.7% |
| 1:37:30 to 1:40:00 | 43 | 3.5% |
| 1:40:00 to 1:42:30 | 34 | 2.8% |
| 1:42:30 to 1:45:00 | 27 | 2.2% |
| 1:45:00 to 1:47:30 | 41 | 3.4% |
| 1:47:30 to 1:50:00 | 15 | 1.2% |
| 1:50:00 to 1:52:30 | 22 | 1.8% |
| 1:52:30 to 1:55:00 | 24 | 2.0% |
| 1:55:00 to 1:57:30 | 22 | 1.8% |
| 1:57:30 to 2:00:00 | 14 | 1.1% |
| 2:00:00 to 2:02:30 | 15 | 1.2% |
| 2:02:30 to 2:05:00 | 13 | 1.1% |
| 2:05:00 to 2:07:30 | 10 | 0.8% |
| 2:07:30 to 2:10:00 | 11 | 0.9% |
| 2:10:00 to 2:12:30 | 10 | 0.8% |
| 2:12:30 to 2:15:00 | 8 | 0.7% |
| 2:15:00 to 2:17:30 | 10 | 0.8% |
| 2:17:30 to 2:20:00 | 5 | 0.4% |
| 2:20:00 to 2:22:30 | 2 | 0.2% |
| 2:22:30 to 2:25:00 | 4 | 0.3% |
| 2:25:00 to 2:27:30 | 8 | 0.7% |
| 2:27:30 to 2:30:00 | 3 | 0.2% |
| 2:30:00 to 2:32:30 | 4 | 0.3% |
| 2:32:30 to 2:35:00 | 2 | 0.2% |
| 2:35:00 to 2:37:30 | 1 | 0.1% |
| 2:37:30 to 2:40:00 | 1 | 0.1% |
| 2:40:00 to 2:42:30 | 0 | 0.0% |
| 2:42:30 to 2:45:00 | 1 | 0.1% |
| 2:45:00 to 2:47:30 | 1 | 0.1% |
| 2:47:30 to 2:50:00 | 0 | 0.0% |
| 2:50:00 to 2:52:30 | 3 | 0.2% |
| 2:52:30 to 2:55:00 | 2 | 0.2% |
| 2:55:00 to 2:57:30 | 0 | 0.0% |
| 2:57:30 to 3:00:00 | 0 | 0.0% |
| 3:00:00 to 3:02:30 | 0 | 0.0% |
| 3:02:30 to 3:05:00 | 0 | 0.0% |
| 3:05:00 to 3:07:30 | 0 | 0.0% |
| 3:07:30 to 3:10:00 | 0 | 0.0% |
| 3:10:00 to 3:12:30 | 0 | 0.0% |
| 3:12:30 to 3:15:00 | 1 | 0.1% |
How to read
Each bar is how many finished in that time slot, fastest on the left, men and women together. Green is the fastest 10%; the line is the typical finish.
| # | Athlete | Age group | Time | |
|---|---|---|---|---|
| 1 | Sam Craig GBR | 35-39 | 54:46 | |
| 2 | Ethan Smith GBR | 30-34 | 55:52 | |
| 3 | Lee Tynan GBR | 35-39 | 56:07 | |
| 4 | Martyn Paterson GBR | 30-34 | 56:29 | |
| 5 | Paul McNulty GBR | 35-39 | 57:29 | |
| 6 | James Payne GBR | 25-29 | 58:11 | |
| 7 | Charlie Cresswell GBR | 30-34 | 58:39 | |
| 8 | Kane Lee GBR | 30-34 | 58:47 | |
| 9 | Ben Vickers GBR | 40-44 | 59:13 | |
| 10 | Henry Lort-Jones GBR | 35-39 | 59:15 | |
| 11 | Stephen O' Reilly IRL | 30-34 | 59:20 | |
| 12 | Zaquery Claeys GBR | 25-29 | 59:22 | |
| 13 | Daire Plunkett IRL | 35-39 | 1:00:07 | |
| 14 | Joshua Braznell GBR | 35-39 | 1:00:08 | |
| 15 | Darren Hancock GBR | 40-44 | 1:00:22 | |
| 16 | Samuel Wilson GBR | 35-39 | 1:00:28 | |
| 17 | Lee Dovey GBR | 35-39 | 1:01:20 | |
| 18 | tony harrison GBR | 45-49 | 1:01:21 | |
| 19 | Dave Bell GBR | 35-39 | 1:01:23 | |
| 20 | Will Wellon GBR | 35-39 | 1:01:23 | |
| 21 | Adam Jenkins GBR | 40-44 | 1:01:31 | |
| 22 | Sam Wright GBR | 35-39 | 1:01:34 | |
| 23 | George Wootten GBR | 25-29 | 1:01:35 | |
| 24 | Chris Marlow GBR | 35-39 | 1:01:43 | |
| 25 | Daniel Hall GBR | 25-29 | 1:01:48 | |
| 26 | Jonathan Rees GBR | 35-39 | 1:01:52 | |
| 27 | Andy Dunkerley GBR | 40-44 | 1:02:00 | |
| 28 | Chris Smith GBR | 35-39 | 1:02:23 | |
| 29 | Phil Hions GBR | 40-44 | 1:02:34 | |
| 30 | Lee Ryder GBR | 40-44 | 1:02:58 | |
| 31 | Kelly Hamilton GBR | 40-44 | 1:03:05 | |
| 32 | Oliver Corson GBR | 25-29 | 1:03:09 | |
| 33 | Simon Courtney GBR | 40-44 | 1:03:15 | |
| 34 | Harry Tierney GBR | 25-29 | 1:03:22 | |
| 35 | Jungwon Kim KOR | 16-24 | 1:03:33 | |
| 36 | Richard Rainford GBR | 45-49 | 1:03:46 | |
| 37 | Tyler Sloane GBR | 30-34 | 1:03:48 | |
| 38 | Ash Smith GBR | 30-34 | 1:04:01 | |
| 39 | George Forrester GBR | 25-29 | 1:04:03 | |
| 40 | Max Golla GBR | 16-24 | 1:04:06 | |
| 41 | Ashton Edwards GBR | 30-34 | 1:04:14 | |
| 42 | Jonathan Lyth GBR | 40-44 | 1:04:15 | |
| 43 | Ian Upcott GBR | 35-39 | 1:04:28 | |
| 44 | Elijah Fleming GBR | 16-24 | 1:04:33 | |
| 45 | Ross Thacker GBR | 30-34 | 1:04:33 | |
| 46 | Steven Broxton GBR | 40-44 | 1:04:33 | |
| 47 | Jack Wilson GBR | 40-44 | 1:04:41 | |
| 48 | Jamie Ovens GBR | 25-29 | 1:04:42 | |
| 49 | Sam Hinchliffe GBR | 35-39 | 1:04:42 | |
| 50 | Tom Clinton GBR | 40-44 | 1:04:43 |
Or type your name above.
Finish times, Open · Wednesday
This chart shows how many athletes finished in each 2.5-minute band, fastest on the left.A field of normal spread with a long slow tail: typical 1:28:17, middle half about 1:18:24 to 1:41:02, fastest 10% (green) under 1:11:46.
See the numbers
| Time band | How many | Share |
|---|---|---|
| 52:30 to 55:00 | 1 | 0.1% |
| 55:00 to 57:30 | 1 | 0.1% |
| 57:30 to 1:00:00 | 8 | 0.6% |
| 1:00:00 to 1:02:30 | 7 | 0.6% |
| 1:02:30 to 1:05:00 | 13 | 1.1% |
| 1:05:00 to 1:07:30 | 24 | 1.9% |
| 1:07:30 to 1:10:00 | 40 | 3.2% |
| 1:10:00 to 1:12:30 | 48 | 3.9% |
| 1:12:30 to 1:15:00 | 61 | 4.9% |
| 1:15:00 to 1:17:30 | 72 | 5.8% |
| 1:17:30 to 1:20:00 | 95 | 7.7% |
| 1:20:00 to 1:22:30 | 66 | 5.3% |
| 1:22:30 to 1:25:00 | 76 | 6.1% |
| 1:25:00 to 1:27:30 | 75 | 6.1% |
| 1:27:30 to 1:30:00 | 94 | 7.6% |
| 1:30:00 to 1:32:30 | 57 | 4.6% |
| 1:32:30 to 1:35:00 | 70 | 5.7% |
| 1:35:00 to 1:37:30 | 52 | 4.2% |
| 1:37:30 to 1:40:00 | 50 | 4.0% |
| 1:40:00 to 1:42:30 | 45 | 3.6% |
| 1:42:30 to 1:45:00 | 36 | 2.9% |
| 1:45:00 to 1:47:30 | 32 | 2.6% |
| 1:47:30 to 1:50:00 | 32 | 2.6% |
| 1:50:00 to 1:52:30 | 24 | 1.9% |
| 1:52:30 to 1:55:00 | 21 | 1.7% |
| 1:55:00 to 1:57:30 | 23 | 1.9% |
| 1:57:30 to 2:00:00 | 17 | 1.4% |
| 2:00:00 to 2:02:30 | 11 | 0.9% |
| 2:02:30 to 2:05:00 | 12 | 1.0% |
| 2:05:00 to 2:07:30 | 6 | 0.5% |
| 2:07:30 to 2:10:00 | 6 | 0.5% |
| 2:10:00 to 2:12:30 | 12 | 1.0% |
| 2:12:30 to 2:15:00 | 9 | 0.7% |
| 2:15:00 to 2:17:30 | 7 | 0.6% |
| 2:17:30 to 2:20:00 | 1 | 0.1% |
| 2:20:00 to 2:22:30 | 1 | 0.1% |
| 2:22:30 to 2:25:00 | 6 | 0.5% |
| 2:25:00 to 2:27:30 | 2 | 0.2% |
| 2:27:30 to 2:30:00 | 3 | 0.2% |
| 2:30:00 to 2:32:30 | 4 | 0.3% |
| 2:32:30 to 2:35:00 | 0 | 0.0% |
| 2:35:00 to 2:37:30 | 3 | 0.2% |
| 2:37:30 to 2:40:00 | 3 | 0.2% |
| 2:40:00 to 2:42:30 | 1 | 0.1% |
| 2:42:30 to 2:45:00 | 3 | 0.2% |
| 2:45:00 to 2:47:30 | 3 | 0.2% |
| 2:47:30 to 2:50:00 | 1 | 0.1% |
| 2:50:00 to 2:52:30 | 0 | 0.0% |
| 2:52:30 to 2:55:00 | 0 | 0.0% |
| 2:55:00 to 2:57:30 | 0 | 0.0% |
| 2:57:30 to 3:00:00 | 1 | 0.1% |
| 3:00:00 to 3:02:30 | 0 | 0.0% |
| 3:02:30 to 3:05:00 | 1 | 0.1% |
| 3:05:00 to 3:07:30 | 0 | 0.0% |
| 3:07:30 to 3:10:00 | 0 | 0.0% |
| 3:10:00 to 3:12:30 | 0 | 0.0% |
| 3:12:30 to 3:15:00 | 1 | 0.1% |
| 3:15:00 to 3:17:30 | 0 | 0.0% |
| 3:17:30 to 3:20:00 | 1 | 0.1% |
How to read
Each bar is how many finished in that time slot, fastest on the left, men and women together. Green is the fastest 10%; the line is the typical finish.
| # | Athlete | Age group | Time | |
|---|---|---|---|---|
| 1 | Cam Rackham GBR | 30-34 | 54:16 | |
| 2 | Luke Parker GBR | 16-24 | 56:45 | |
| 3 | Dion Battes GBR | 25-29 | 58:15 | |
| 4 | Adam Hale GBR | 35-39 | 58:15 | |
| 5 | Phil Ellison GBR | 45-49 | 58:57 | |
| 6 | Freddy Pett GBR | 35-39 | 58:57 | |
| 7 | HUXLEY CRUSH GBR | 16-24 | 59:00 | |
| 8 | Jacob Keane GBR | 25-29 | 59:05 | |
| 9 | Andrew Langley GBR | 40-44 | 59:16 | |
| 10 | bradley johnson GBR | 35-39 | 59:26 | |
| 11 | Jibs Ismail GBR | 30-34 | 1:00:09 | |
| 12 | Lewis Paton GBR | 30-34 | 1:00:22 | |
| 13 | Alex Birbeck GBR | 30-34 | 1:00:36 | |
| 14 | Matt Surridge GBR | 30-34 | 1:00:43 | |
| 15 | Gordon Stables GBR | 40-44 | 1:02:04 | |
| 16 | Billy McDonough GBR | 16-24 | 1:02:21 | |
| 17 | Jordon Scott GBR | 30-34 | 1:02:27 | |
| 18 | Daniel Tuck GBR | 25-29 | 1:02:33 | |
| 19 | Jospeh Kemp GBR | 35-39 | 1:02:54 | |
| 20 | Jack Templeton GBR | 16-24 | 1:03:16 | |
| 21 | Ben Parry GBR | 30-34 | 1:03:26 | |
| 22 | Richard Wilder GBR | 50-54 | 1:03:30 | |
| 23 | Lewys Mccafferty GBR | 16-24 | 1:03:42 | |
| 24 | Ollie Eastwood GBR | 25-29 | 1:03:50 | |
| 25 | Faith Smallwood GBR | 16-24 | 1:03:53 | |
| 26 | James Laws GBR | 16-24 | 1:04:01 | |
| 27 | Gregor Johnston GBR | 25-29 | 1:04:03 | |
| 28 | Billy Flitcroft GBR | 16-24 | 1:04:46 | |
| 29 | Robert McWilliams GBR | 30-34 | 1:04:51 | |
| 30 | George Wass GBR | 25-29 | 1:04:54 | |
| 31 | Jonny Taylor GBR | 30-34 | 1:05:01 | |
| 32 | Ashley Dickson GBR | 35-39 | 1:05:06 | |
| 33 | Eoin Hannigan IRL | 35-39 | 1:05:07 | |
| 34 | Kane Tinnion GBR | 35-39 | 1:05:21 | |
| 35 | Callum McDougall GBR | 25-29 | 1:05:22 | |
| 36 | Rory Grant GBR | 30-34 | 1:05:22 | |
| 37 | Will Ralph GBR | 16-24 | 1:05:23 | |
| 38 | Elliot Das Gupta GBR | 16-24 | 1:05:25 | |
| 39 | Josh Isaac GBR | 35-39 | 1:05:32 | |
| 40 | Luke Burrows GBR | 30-34 | 1:05:40 | |
| 41 | Scott Bailey GBR | 30-34 | 1:05:43 | |
| 42 | Joshua Lemm GBR | 25-29 | 1:06:01 | |
| 43 | Will Farnaby GBR | 16-24 | 1:06:05 | |
| 44 | Scott Wallace GBR | 35-39 | 1:06:15 | |
| 45 | Nathan Williams GBR | 25-29 | 1:06:28 | |
| 46 | Troy Mainstone GBR | 35-39 | 1:06:31 | |
| 47 | Adam Dyer GBR | 30-34 | 1:06:34 | |
| 48 | Jason Coster IRL | 30-34 | 1:06:35 | |
| 49 | Gwion Ellis GBR | 16-24 | 1:06:48 | |
| 50 | Andrew Bell GBR | 35-39 | 1:06:51 |
Or type your name above.
Finish times, Open · Thursday
This chart shows how many athletes finished in each 2.5-minute band, fastest on the left.A field of normal spread with a long slow tail: typical 1:28:03, middle half about 1:18:06 to 1:39:42, fastest 10% (green) under 1:10:55.
See the numbers
| Time band | How many | Share |
|---|---|---|
| 55:00 to 57:30 | 1 | 0.1% |
| 57:30 to 1:00:00 | 5 | 0.4% |
| 1:00:00 to 1:02:30 | 12 | 1.0% |
| 1:02:30 to 1:05:00 | 18 | 1.5% |
| 1:05:00 to 1:07:30 | 28 | 2.3% |
| 1:07:30 to 1:10:00 | 43 | 3.6% |
| 1:10:00 to 1:12:30 | 46 | 3.8% |
| 1:12:30 to 1:15:00 | 61 | 5.1% |
| 1:15:00 to 1:17:30 | 66 | 5.5% |
| 1:17:30 to 1:20:00 | 80 | 6.7% |
| 1:20:00 to 1:22:30 | 82 | 6.9% |
| 1:22:30 to 1:25:00 | 59 | 4.9% |
| 1:25:00 to 1:27:30 | 83 | 6.9% |
| 1:27:30 to 1:30:00 | 73 | 6.1% |
| 1:30:00 to 1:32:30 | 76 | 6.3% |
| 1:32:30 to 1:35:00 | 59 | 4.9% |
| 1:35:00 to 1:37:30 | 59 | 4.9% |
| 1:37:30 to 1:40:00 | 53 | 4.4% |
| 1:40:00 to 1:42:30 | 35 | 2.9% |
| 1:42:30 to 1:45:00 | 39 | 3.3% |
| 1:45:00 to 1:47:30 | 31 | 2.6% |
| 1:47:30 to 1:50:00 | 23 | 1.9% |
| 1:50:00 to 1:52:30 | 18 | 1.5% |
| 1:52:30 to 1:55:00 | 21 | 1.8% |
| 1:55:00 to 1:57:30 | 20 | 1.7% |
| 1:57:30 to 2:00:00 | 19 | 1.6% |
| 2:00:00 to 2:02:30 | 11 | 0.9% |
| 2:02:30 to 2:05:00 | 8 | 0.7% |
| 2:05:00 to 2:07:30 | 15 | 1.3% |
| 2:07:30 to 2:10:00 | 10 | 0.8% |
| 2:10:00 to 2:12:30 | 7 | 0.6% |
| 2:12:30 to 2:15:00 | 5 | 0.4% |
| 2:15:00 to 2:17:30 | 5 | 0.4% |
| 2:17:30 to 2:20:00 | 1 | 0.1% |
| 2:20:00 to 2:22:30 | 5 | 0.4% |
| 2:22:30 to 2:25:00 | 2 | 0.2% |
| 2:25:00 to 2:27:30 | 0 | 0.0% |
| 2:27:30 to 2:30:00 | 0 | 0.0% |
| 2:30:00 to 2:32:30 | 3 | 0.3% |
| 2:32:30 to 2:35:00 | 4 | 0.3% |
| 2:35:00 to 2:37:30 | 0 | 0.0% |
| 2:37:30 to 2:40:00 | 1 | 0.1% |
| 2:40:00 to 2:42:30 | 1 | 0.1% |
| 2:42:30 to 2:45:00 | 2 | 0.2% |
| 2:45:00 to 2:47:30 | 2 | 0.2% |
| 2:47:30 to 2:50:00 | 2 | 0.2% |
| 2:50:00 to 2:52:30 | 0 | 0.0% |
| 2:52:30 to 2:55:00 | 1 | 0.1% |
| 2:55:00 to 2:57:30 | 1 | 0.1% |
| 2:57:30 to 3:00:00 | 0 | 0.0% |
| 3:00:00 to 3:02:30 | 0 | 0.0% |
| 3:02:30 to 3:05:00 | 0 | 0.0% |
| 3:05:00 to 3:07:30 | 0 | 0.0% |
| 3:07:30 to 3:10:00 | 0 | 0.0% |
| 3:10:00 to 3:12:30 | 0 | 0.0% |
| 3:12:30 to 3:15:00 | 0 | 0.0% |
| 3:15:00 to 3:17:30 | 0 | 0.0% |
| 3:17:30 to 3:20:00 | 1 | 0.1% |
How to read
Each bar is how many finished in that time slot, fastest on the left, men and women together. Green is the fastest 10%; the line is the typical finish.
| # | Athlete | Age group | Time | |
|---|---|---|---|---|
| 1 | Robert Cowan GBR | 40-44 | 57:00 | |
| 2 | Jye Spriggs AUS | 30-34 | 57:49 | |
| 3 | Tom Hodgins GBR | 30-34 | 58:51 | |
| 4 | Dom Brown GBR | 30-34 | 58:54 | |
| 5 | Jordan Arrand GBR | 30-34 | 59:39 | |
| 6 | Nathan Chowns Higgs GBR | 16-24 | 59:52 | |
| 7 | Alex Raistrick GBR | 35-39 | 1:00:08 | |
| 8 | Tom Haseldine GBR | 16-24 | 1:00:12 | |
| 9 | Will Atkinson GBR | 30-34 | 1:00:14 | |
| 10 | Rhys Griffiths GBR | 25-29 | 1:00:28 | |
| 11 | Patrick Brown GBR | 45-49 | 1:00:36 | |
| 12 | Richard Gill GBR | 35-39 | 1:01:11 | |
| 13 | Will Mitchell GBR | 30-34 | 1:01:29 | |
| 14 | Guy West GBR | 30-34 | 1:01:30 | |
| 15 | Pete Daalman SCO | 40-44 | 1:01:33 | |
| 16 | Louis Ambert GBR | 25-29 | 1:01:43 | |
| 17 | Bethany Ord GBR | 25-29 | 1:01:44 | |
| 18 | Joe Williams GBR | 30-34 | 1:02:17 | |
| 19 | Rachel Moodie GBR | 25-29 | 1:02:33 | |
| 20 | Lee Johnson GBR | 35-39 | 1:02:43 | |
| 21 | Dylan Walton WLS | 30-34 | 1:02:44 | |
| 22 | Dean Philpott GBR | 30-34 | 1:03:02 | |
| 23 | Luke Bailey GBR | 35-39 | 1:03:28 | |
| 24 | Elliot Sharp GBR | 25-29 | 1:03:29 | |
| 25 | Holly Jones IRL | 16-24 | 1:03:55 | |
| 26 | Martin Brien GBR | 35-39 | 1:04:06 | |
| 27 | Callum Lee GBR | 30-34 | 1:04:06 | |
| 28 | Jake Pearce GBR | 25-29 | 1:04:11 | |
| 29 | Zac Randall GBR | 30-34 | 1:04:16 | |
| 30 | Stuart Smith GBR | 30-34 | 1:04:21 | |
| 31 | Ryan Power GBR | 16-24 | 1:04:29 | |
| 32 | Mark Winslade GBR | 30-34 | 1:04:31 | |
| 33 | Nicholas Astley GBR | 30-34 | 1:04:39 | |
| 34 | Christopher Sim GBR | 30-34 | 1:04:47 | |
| 35 | jack morse GBR | 25-29 | 1:04:50 | |
| 36 | Shane Macdonald GBR | 35-39 | 1:04:58 | |
| 37 | James Robertson GBR | 25-29 | 1:05:01 | |
| 38 | James Davies GBR | 40-44 | 1:05:10 | |
| 39 | Nick Hamlin GBR | 35-39 | 1:05:16 | |
| 40 | Rhys Morgans GBR | 30-34 | 1:05:30 | |
| 41 | Caity Preddy GBR | 16-24 | 1:05:30 | |
| 42 | Jamie Hyde GBR | 40-44 | 1:05:36 | |
| 43 | stephanie williams GBR | 30-34 | 1:05:41 | |
| 44 | Kyle Pirie GBR | 25-29 | 1:05:42 | |
| 45 | EMILY WALLIS GBR | 35-39 | 1:05:46 | |
| 46 | Ross Crombie GBR | 50-54 | 1:05:51 | |
| 47 | Nathan Jones GBR | 35-39 | 1:06:15 | |
| 48 | Maria Lynwood GBR | 25-29 | 1:06:16 | |
| 49 | Neil Campbell GBR | 40-44 | 1:06:17 | |
| 50 | Andrew Taylor GBR | 35-39 | 1:06:23 |
Or type your name above.
Finish times, Open · Friday
This chart shows how many athletes finished in each 2.5-minute band, fastest on the left.A field of normal spread: typical 1:27:46, middle half about 1:17:08 to 1:39:26, fastest 10% (green) under 1:09:31.
See the numbers
| Time band | How many | Share |
|---|---|---|
| 57:30 to 1:00:00 | 5 | 0.8% |
| 1:00:00 to 1:02:30 | 8 | 1.3% |
| 1:02:30 to 1:05:00 | 13 | 2.0% |
| 1:05:00 to 1:07:30 | 21 | 3.3% |
| 1:07:30 to 1:10:00 | 25 | 3.9% |
| 1:10:00 to 1:12:30 | 25 | 3.9% |
| 1:12:30 to 1:15:00 | 35 | 5.5% |
| 1:15:00 to 1:17:30 | 32 | 5.0% |
| 1:17:30 to 1:20:00 | 31 | 4.9% |
| 1:20:00 to 1:22:30 | 33 | 5.2% |
| 1:22:30 to 1:25:00 | 38 | 6.0% |
| 1:25:00 to 1:27:30 | 51 | 8.0% |
| 1:27:30 to 1:30:00 | 33 | 5.2% |
| 1:30:00 to 1:32:30 | 38 | 6.0% |
| 1:32:30 to 1:35:00 | 33 | 5.2% |
| 1:35:00 to 1:37:30 | 32 | 5.0% |
| 1:37:30 to 1:40:00 | 32 | 5.0% |
| 1:40:00 to 1:42:30 | 23 | 3.6% |
| 1:42:30 to 1:45:00 | 19 | 3.0% |
| 1:45:00 to 1:47:30 | 21 | 3.3% |
| 1:47:30 to 1:50:00 | 14 | 2.2% |
| 1:50:00 to 1:52:30 | 6 | 0.9% |
| 1:52:30 to 1:55:00 | 11 | 1.7% |
| 1:55:00 to 1:57:30 | 7 | 1.1% |
| 1:57:30 to 2:00:00 | 4 | 0.6% |
| 2:00:00 to 2:02:30 | 5 | 0.8% |
| 2:02:30 to 2:05:00 | 3 | 0.5% |
| 2:05:00 to 2:07:30 | 5 | 0.8% |
| 2:07:30 to 2:10:00 | 6 | 0.9% |
| 2:10:00 to 2:12:30 | 3 | 0.5% |
| 2:12:30 to 2:15:00 | 1 | 0.2% |
| 2:15:00 to 2:17:30 | 3 | 0.5% |
| 2:17:30 to 2:20:00 | 2 | 0.3% |
| 2:20:00 to 2:22:30 | 3 | 0.5% |
| 2:22:30 to 2:25:00 | 1 | 0.2% |
| 2:25:00 to 2:27:30 | 2 | 0.3% |
| 2:27:30 to 2:30:00 | 1 | 0.2% |
| 2:30:00 to 2:32:30 | 3 | 0.5% |
| 2:32:30 to 2:35:00 | 1 | 0.2% |
| 2:35:00 to 2:37:30 | 3 | 0.5% |
| 2:37:30 to 2:40:00 | 0 | 0.0% |
| 2:40:00 to 2:42:30 | 1 | 0.2% |
| 2:42:30 to 2:45:00 | 2 | 0.3% |
| 2:45:00 to 2:47:30 | 2 | 0.3% |
How to read
Each bar is how many finished in that time slot, fastest on the left, men and women together. Green is the fastest 10%; the line is the typical finish.
| # | Athlete | Age group | Time | |
|---|---|---|---|---|
| 1 | Niall Coleridge GBR | 25-29 | 57:57 | |
| 2 | Jake White GBR | 25-29 | 59:33 | |
| 3 | Bradley Shearwood GBR | 30-34 | 59:33 | |
| 4 | Charlie Brown GBR | 16-24 | 59:34 | |
| 5 | Michael Clark GBR | 30-34 | 59:48 | |
| 6 | Stewart Horn SCO | 35-39 | 1:00:10 | |
| 7 | Christopher Gunson GBR | 25-29 | 1:00:29 | |
| 8 | Alan Downey IRL | 25-29 | 1:00:45 | |
| 9 | Chris Norris GBR | 35-39 | 1:00:52 | |
| 10 | Peter Roberts GBR | 30-34 | 1:01:32 | |
| 11 | Alex Osborn GBR | 35-39 | 1:01:56 | |
| 12 | Harry Whitehead GBR | 25-29 | 1:02:11 | |
| 13 | Tom Penzer Adams GBR | 35-39 | 1:02:17 | |
| 14 | Ross Nicholson GBR | 30-34 | 1:02:33 | |
| 15 | Darren McEvoy IRL | 30-34 | 1:03:15 | |
| 16 | Zachary Deponio GBR | 30-34 | 1:03:17 | |
| 17 | Jason Knight GBR | 25-29 | 1:03:33 | |
| 18 | Aaron Evans GBR | 35-39 | 1:03:47 | |
| 19 | Callum Fearon IRL | 25-29 | 1:03:58 | |
| 20 | Shane Gaskell GBR | 35-39 | 1:04:12 | |
| 21 | Liam Carroll GBR | 25-29 | 1:04:13 | |
| 22 | Matthew Coar GBR | 30-34 | 1:04:21 | |
| 23 | Cynan Jones GBR | 16-24 | 1:04:28 | |
| 24 | Robert Hoey IRL | 35-39 | 1:04:33 | |
| 25 | Jake Nutt GBR | 25-29 | 1:04:40 | |
| 26 | Ryan Stirton GBR | 25-29 | 1:04:48 | |
| 27 | Kyle Allsworth GBR | 30-34 | 1:05:03 | |
| 28 | Michael Hamilton GBR | 30-34 | 1:05:08 | |
| 29 | Ben Gillin GBR | 25-29 | 1:05:29 | |
| 30 | Dom Healey GBR | 30-34 | 1:05:35 | |
| 31 | C-jay Mort GBR | 30-34 | 1:05:36 | |
| 32 | Charlie Huteson GBR | 25-29 | 1:05:40 | |
| 33 | Chris Collins GBR | 35-39 | 1:05:47 | |
| 34 | Joe Kay GBR | 45-49 | 1:05:57 | |
| 35 | John Walker GBR | 25-29 | 1:05:58 | |
| 36 | Rossi Beard GBR | 16-24 | 1:06:07 | |
| 37 | Darren Morgan GBR | 40-44 | 1:06:07 | |
| 38 | Michael Gillett GBR | 25-29 | 1:06:09 | |
| 39 | Steven Gilmour GBR | 35-39 | 1:06:16 | |
| 40 | Kieran Lane GBR | 16-24 | 1:06:17 | |
| 41 | Alan Armstrong GBR | 35-39 | 1:06:35 | |
| 42 | Jamie Mcbratney GBR | 16-24 | 1:06:36 | |
| 43 | Pete Phillips IRL | 30-34 | 1:06:38 | |
| 44 | Jay Madelaine GBR | 25-29 | 1:06:57 | |
| 45 | Chris Grieveson GBR | 45-49 | 1:06:58 | |
| 46 | Michela Borzoni GBR | 30-34 | 1:07:18 | |
| 47 | Tom Wellstead GBR | 30-34 | 1:07:29 | |
| 48 | Sam Parkinson GBR | 30-34 | 1:07:34 | |
| 49 | Sam Brown GBR | 30-34 | 1:07:58 | |
| 50 | Nathan Dunn GBR | 35-39 | 1:08:06 |
Or type your name above.
Finish times, Open · Saturday
This chart shows how many athletes finished in each 2.5-minute band, fastest on the left.A field of normal spread: typical 1:23:29, middle half about 1:13:53 to 1:35:07, fastest 10% (green) under 1:06:58.
See the numbers
| Time band | How many | Share |
|---|---|---|
| 55:00 to 57:30 | 2 | 0.2% |
| 57:30 to 1:00:00 | 20 | 1.5% |
| 1:00:00 to 1:02:30 | 28 | 2.1% |
| 1:02:30 to 1:05:00 | 31 | 2.3% |
| 1:05:00 to 1:07:30 | 64 | 4.8% |
| 1:07:30 to 1:10:00 | 70 | 5.3% |
| 1:10:00 to 1:12:30 | 59 | 4.5% |
| 1:12:30 to 1:15:00 | 102 | 7.7% |
| 1:15:00 to 1:17:30 | 76 | 5.8% |
| 1:17:30 to 1:20:00 | 96 | 7.3% |
| 1:20:00 to 1:22:30 | 82 | 6.2% |
| 1:22:30 to 1:25:00 | 89 | 6.7% |
| 1:25:00 to 1:27:30 | 78 | 5.9% |
| 1:27:30 to 1:30:00 | 81 | 6.1% |
| 1:30:00 to 1:32:30 | 62 | 4.7% |
| 1:32:30 to 1:35:00 | 48 | 3.6% |
| 1:35:00 to 1:37:30 | 59 | 4.5% |
| 1:37:30 to 1:40:00 | 45 | 3.4% |
| 1:40:00 to 1:42:30 | 40 | 3.0% |
| 1:42:30 to 1:45:00 | 31 | 2.3% |
| 1:45:00 to 1:47:30 | 27 | 2.0% |
| 1:47:30 to 1:50:00 | 24 | 1.8% |
| 1:50:00 to 1:52:30 | 12 | 0.9% |
| 1:52:30 to 1:55:00 | 17 | 1.3% |
| 1:55:00 to 1:57:30 | 18 | 1.4% |
| 1:57:30 to 2:00:00 | 7 | 0.5% |
| 2:00:00 to 2:02:30 | 10 | 0.8% |
| 2:02:30 to 2:05:00 | 11 | 0.8% |
| 2:05:00 to 2:07:30 | 2 | 0.2% |
| 2:07:30 to 2:10:00 | 4 | 0.3% |
| 2:10:00 to 2:12:30 | 4 | 0.3% |
| 2:12:30 to 2:15:00 | 3 | 0.2% |
| 2:15:00 to 2:17:30 | 3 | 0.2% |
| 2:17:30 to 2:20:00 | 0 | 0.0% |
| 2:20:00 to 2:22:30 | 1 | 0.1% |
| 2:22:30 to 2:25:00 | 2 | 0.2% |
| 2:25:00 to 2:27:30 | 2 | 0.2% |
| 2:27:30 to 2:30:00 | 2 | 0.2% |
| 2:30:00 to 2:32:30 | 1 | 0.1% |
| 2:32:30 to 2:35:00 | 1 | 0.1% |
| 2:35:00 to 2:37:30 | 0 | 0.0% |
| 2:37:30 to 2:40:00 | 2 | 0.2% |
| 2:40:00 to 2:42:30 | 2 | 0.2% |
| 2:42:30 to 2:45:00 | 0 | 0.0% |
| 2:45:00 to 2:47:30 | 0 | 0.0% |
| 2:47:30 to 2:50:00 | 0 | 0.0% |
| 2:50:00 to 2:52:30 | 1 | 0.1% |
| 2:52:30 to 2:55:00 | 1 | 0.1% |
| 2:55:00 to 2:57:30 | 0 | 0.0% |
| 2:57:30 to 3:00:00 | 0 | 0.0% |
| 3:00:00 to 3:02:30 | 0 | 0.0% |
| 3:02:30 to 3:05:00 | 0 | 0.0% |
| 3:05:00 to 3:07:30 | 1 | 0.1% |
How to read
Each bar is how many finished in that time slot, fastest on the left, men and women together. Green is the fastest 10%; the line is the typical finish.
| # | Athlete | Age group | Time | |
|---|---|---|---|---|
| 1 | Tom Oxley (Ainscough) GBR | 25-29 | 55:28 | |
| 2 | Jack Wilson GBR | 25-29 | 57:03 | |
| 3 | Aiden Martin GBR | 16-24 | 57:41 | |
| 4 | Nick O Donovan IRL | 30-34 | 58:12 | |
| 5 | Freddie Davies GBR | 16-24 | 58:42 | |
| 6 | Steve Powell GBR | 35-39 | 58:47 | |
| 7 | Mackenzie Heaney GBR | 25-29 | 58:57 | |
| 8 | Ross Parkin GBR | 25-29 | 58:57 | |
| 9 | Gary Crawford SCO | 35-39 | 59:00 | |
| 10 | Oscar Marshall WLS | 16-24 | 59:04 | |
| 11 | Kyle Turner WLS | 25-29 | 59:15 | |
| 12 | Luke Dickson GBR | 25-29 | 59:20 | |
| 13 | Luke Duffy GBR | 25-29 | 59:20 | |
| 14 | Jak Williams GBR | 25-29 | 59:22 | |
| 15 | Stewart McCarroll GBR | 35-39 | 59:22 | |
| 16 | Tom Stirrup GBR | 30-34 | 59:24 | |
| 17 | Toby Wilkins GBR | 25-29 | 59:35 | |
| 18 | Phil O'Halloran IRL | 40-44 | 59:38 | |
| 19 | Evan Boyle GBR | 25-29 | 59:42 | |
| 20 | Simon day GBR | 40-44 | 59:44 | |
| 21 | Luke Mitchell GBR | 35-39 | 59:45 | |
| 22 | Lucas Robinson GBR | 16-24 | 59:59 | |
| 23 | Conor Henry GBR | 30-34 | 1:00:01 | |
| 24 | Mark Magee GBR | 40-44 | 1:00:04 | |
| 25 | Alex Gibb GBR | 16-24 | 1:00:07 | |
| 26 | Carl Hill GBR | 30-34 | 1:00:20 | |
| 27 | bradley johnson GBR | 35-39 | 1:00:26 | |
| 28 | Ciaran McAdam IRL | 30-34 | 1:00:37 | |
| 29 | Michael Vallely IRL | 30-34 | 1:00:39 | |
| 30 | Brad Dowdall GBR | 25-29 | 1:00:41 | |
| 31 | george grayson GBR | 30-34 | 1:00:42 | |
| 32 | Harry Duncan GBR | 16-24 | 1:00:46 | |
| 33 | Eimard Legaspi GBR | 25-29 | 1:00:54 | |
| 34 | Luke Maher IRL | 16-24 | 1:01:00 | |
| 35 | Neil Carr GBR | 40-44 | 1:01:08 | |
| 36 | Jamie Marsland GBR | 35-39 | 1:01:11 | |
| 37 | Jacob Lidgett GBR | 25-29 | 1:01:18 | |
| 38 | Aiden Wicks GBR | 25-29 | 1:01:20 | |
| 39 | alex foster GBR | 40-44 | 1:01:21 | |
| 40 | Erhan Nurettin GBR | 25-29 | 1:01:26 | |
| 41 | Tom Brickman GBR | 30-34 | 1:01:27 | |
| 42 | Ben Harris GBR | 45-49 | 1:01:51 | |
| 43 | Jordan Macdonald GBR | 30-34 | 1:01:54 | |
| 44 | John Murtagh IRL | 35-39 | 1:02:02 | |
| 45 | Stein Montgomery GBR | 30-34 | 1:02:08 | |
| 46 | Dom Swann GBR | 45-49 | 1:02:10 | |
| 47 | Grant McDonald GBR | 35-39 | 1:02:10 | |
| 48 | Ross Morley GBR | 35-39 | 1:02:12 | |
| 49 | Joseph Waterworth GBR | 35-39 | 1:02:18 | |
| 50 | Thomas McKenna IRL | 35-39 | 1:02:22 |
Or type your name above.
Finish times, Open · Sunday
This chart shows how many athletes finished in each 2.5-minute band, fastest on the left.A field of normal spread with a long slow tail: typical 1:33:59, middle half about 1:23:48 to 1:47:50, fastest 10% (green) under 1:16:04.
See the numbers
| Time band | How many | Share |
|---|---|---|
| 1:02:30 to 1:05:00 | 3 | 0.3% |
| 1:05:00 to 1:07:30 | 11 | 1.2% |
| 1:07:30 to 1:10:00 | 15 | 1.6% |
| 1:10:00 to 1:12:30 | 19 | 2.0% |
| 1:12:30 to 1:15:00 | 31 | 3.3% |
| 1:15:00 to 1:17:30 | 46 | 4.9% |
| 1:17:30 to 1:20:00 | 43 | 4.6% |
| 1:20:00 to 1:22:30 | 34 | 3.7% |
| 1:22:30 to 1:25:00 | 59 | 6.3% |
| 1:25:00 to 1:27:30 | 59 | 6.3% |
| 1:27:30 to 1:30:00 | 55 | 5.9% |
| 1:30:00 to 1:32:30 | 55 | 5.9% |
| 1:32:30 to 1:35:00 | 66 | 7.1% |
| 1:35:00 to 1:37:30 | 54 | 5.8% |
| 1:37:30 to 1:40:00 | 51 | 5.5% |
| 1:40:00 to 1:42:30 | 23 | 2.5% |
| 1:42:30 to 1:45:00 | 32 | 3.4% |
| 1:45:00 to 1:47:30 | 38 | 4.1% |
| 1:47:30 to 1:50:00 | 32 | 3.4% |
| 1:50:00 to 1:52:30 | 26 | 2.8% |
| 1:52:30 to 1:55:00 | 18 | 1.9% |
| 1:55:00 to 1:57:30 | 25 | 2.7% |
| 1:57:30 to 2:00:00 | 17 | 1.8% |
| 2:00:00 to 2:02:30 | 13 | 1.4% |
| 2:02:30 to 2:05:00 | 22 | 2.4% |
| 2:05:00 to 2:07:30 | 9 | 1.0% |
| 2:07:30 to 2:10:00 | 10 | 1.1% |
| 2:10:00 to 2:12:30 | 12 | 1.3% |
| 2:12:30 to 2:15:00 | 7 | 0.8% |
| 2:15:00 to 2:17:30 | 6 | 0.6% |
| 2:17:30 to 2:20:00 | 7 | 0.8% |
| 2:20:00 to 2:22:30 | 4 | 0.4% |
| 2:22:30 to 2:25:00 | 3 | 0.3% |
| 2:25:00 to 2:27:30 | 4 | 0.4% |
| 2:27:30 to 2:30:00 | 3 | 0.3% |
| 2:30:00 to 2:32:30 | 1 | 0.1% |
| 2:32:30 to 2:35:00 | 6 | 0.6% |
| 2:35:00 to 2:37:30 | 0 | 0.0% |
| 2:37:30 to 2:40:00 | 2 | 0.2% |
| 2:40:00 to 2:42:30 | 1 | 0.1% |
| 2:42:30 to 2:45:00 | 0 | 0.0% |
| 2:45:00 to 2:47:30 | 1 | 0.1% |
| 2:47:30 to 2:50:00 | 1 | 0.1% |
| 2:50:00 to 2:52:30 | 1 | 0.1% |
| 2:52:30 to 2:55:00 | 1 | 0.1% |
| 2:55:00 to 2:57:30 | 1 | 0.1% |
| 2:57:30 to 3:00:00 | 0 | 0.0% |
| 3:00:00 to 3:02:30 | 0 | 0.0% |
| 3:02:30 to 3:05:00 | 0 | 0.0% |
| 3:05:00 to 3:07:30 | 1 | 0.1% |
| 3:07:30 to 3:10:00 | 0 | 0.0% |
| 3:10:00 to 3:12:30 | 0 | 0.0% |
| 3:12:30 to 3:15:00 | 1 | 0.1% |
| 3:15:00 to 3:17:30 | 2 | 0.2% |
How to read
Each bar is how many finished in that time slot, fastest on the left, men and women together. Green is the fastest 10%; the line is the typical finish.
| # | Athlete | Age group | Time | |
|---|---|---|---|---|
| 1 | Ellie Wilkinson GBR | 25-29 | 1:03:15 | |
| 2 | Sheridan Craig GBR | 30-34 | 1:03:52 | |
| 3 | Maddie Fallon GBR | 30-34 | 1:04:57 | |
| 4 | Jayne Court GBR | 35-39 | 1:05:13 | |
| 5 | Nicola MacBeth AUS | 30-34 | 1:05:29 | |
| 6 | Shannon Ryan GBR | 25-29 | 1:06:19 | |
| 7 | Natalie Darlington GBR | 35-39 | 1:06:32 | |
| 8 | Liz Peapell GBR | 40-44 | 1:06:36 | |
| 9 | Lynn Harris GBR | 40-44 | 1:06:42 | |
| 10 | Kayleigh Mifsud GBR | 35-39 | 1:06:46 | |
| 11 | Hazel Burcham GBR | 30-34 | 1:07:00 | |
| 12 | Lucy Howells GBR | 30-34 | 1:07:07 | |
| 13 | Elizabeth Nairn GBR | 40-44 | 1:07:24 | |
| 14 | Georgia Myers GBR | 16-24 | 1:07:27 | |
| 15 | Josephine Jones GBR | 25-29 | 1:07:37 | |
| 16 | Kirsty Boyd GBR | 25-29 | 1:07:40 | |
| 17 | Jade Parry GBR | 16-24 | 1:07:40 | |
| 18 | Martha Davis GBR | 25-29 | 1:07:53 | |
| 19 | Amy Haynes GBR | 16-24 | 1:08:06 | |
| 20 | Laura Harling GBR | 40-44 | 1:08:14 | |
| 21 | Aoife McGrath IRL | 16-24 | 1:08:14 | |
| 22 | Charlotte Haywood-Percival GBR | 16-24 | 1:08:23 | |
| 23 | Ellie Muir GBR | 25-29 | 1:08:31 | |
| 24 | Holly Climo GBR | 30-34 | 1:08:42 | |
| 25 | Hannah Cierebiej-Jeffery GBR | 30-34 | 1:08:45 | |
| 26 | Emma Blair GBR | 16-24 | 1:08:55 | |
| 27 | Holly Burlton GBR | 35-39 | 1:09:23 | |
| 28 | Zoe Taylor GBR | 25-29 | 1:09:29 | |
| 29 | Emma Brown GBR | 40-44 | 1:09:42 | |
| 30 | Charlotte Johnson GBR | 30-34 | 1:10:03 | |
| 31 | Molly Simmons GBR | 16-24 | 1:10:04 | |
| 32 | Chloe Lepage GBR | 25-29 | 1:10:14 | |
| 33 | Lauren Gillman GBR | 25-29 | 1:10:15 | |
| 34 | Naomi Anderson GBR | 45-49 | 1:10:31 | |
| 35 | Chloe Hand GBR | 25-29 | 1:10:45 | |
| 36 | Penny Townsend GBR | 16-24 | 1:10:56 | |
| 37 | Rachel Moran GBR | 16-24 | 1:10:59 | |
| 38 | Nicola Byrom GBR | 35-39 | 1:11:02 | |
| 39 | Katie Main GBR | 25-29 | 1:11:20 | |
| 40 | Emily Harrison GBR | 35-39 | 1:11:23 | |
| 41 | Georgia Fox GBR | 16-24 | 1:11:25 | |
| 42 | Ceris Workman GBR | 45-49 | 1:11:31 | |
| 43 | Sarah Mcgough GBR | 35-39 | 1:11:35 | |
| 44 | Emma Wilson GBR | 35-39 | 1:11:39 | |
| 45 | Molly Spruce GBR | 16-24 | 1:12:11 | |
| 46 | Chloe Read GBR | 25-29 | 1:12:13 | |
| 47 | Gina Wynter GBR | 25-29 | 1:12:20 | |
| 48 | Becky Evans GBR | 40-44 | 1:12:26 | |
| 49 | Rashedah Samuels GBR | 30-34 | 1:12:34 | |
| 50 | Evie Wastnage GBR | 16-24 | 1:12:51 |
Or type your name above.
Finish times, Doubles · Tuesday
This chart shows how many athletes finished in each 2.5-minute band, fastest on the left.A field of normal spread: typical 1:21:24, middle half about 1:11:51 to 1:31:32, fastest 10% (green) under 1:04:37.
See the numbers
| Time band | How many | Share |
|---|---|---|
| 50:00 to 52:30 | 3 | 0.2% |
| 52:30 to 55:00 | 7 | 0.4% |
| 55:00 to 57:30 | 11 | 0.6% |
| 57:30 to 1:00:00 | 39 | 2.2% |
| 1:00:00 to 1:02:30 | 66 | 3.7% |
| 1:02:30 to 1:05:00 | 65 | 3.7% |
| 1:05:00 to 1:07:30 | 72 | 4.1% |
| 1:07:30 to 1:10:00 | 108 | 6.1% |
| 1:10:00 to 1:12:30 | 96 | 5.4% |
| 1:12:30 to 1:15:00 | 106 | 6.0% |
| 1:15:00 to 1:17:30 | 118 | 6.7% |
| 1:17:30 to 1:20:00 | 136 | 7.7% |
| 1:20:00 to 1:22:30 | 119 | 6.7% |
| 1:22:30 to 1:25:00 | 128 | 7.2% |
| 1:25:00 to 1:27:30 | 123 | 7.0% |
| 1:27:30 to 1:30:00 | 88 | 5.0% |
| 1:30:00 to 1:32:30 | 68 | 3.8% |
| 1:32:30 to 1:35:00 | 87 | 4.9% |
| 1:35:00 to 1:37:30 | 56 | 3.2% |
| 1:37:30 to 1:40:00 | 47 | 2.7% |
| 1:40:00 to 1:42:30 | 43 | 2.4% |
| 1:42:30 to 1:45:00 | 34 | 1.9% |
| 1:45:00 to 1:47:30 | 30 | 1.7% |
| 1:47:30 to 1:50:00 | 24 | 1.4% |
| 1:50:00 to 1:52:30 | 20 | 1.1% |
| 1:52:30 to 1:55:00 | 12 | 0.7% |
| 1:55:00 to 1:57:30 | 9 | 0.5% |
| 1:57:30 to 2:00:00 | 9 | 0.5% |
| 2:00:00 to 2:02:30 | 9 | 0.5% |
| 2:02:30 to 2:05:00 | 9 | 0.5% |
| 2:05:00 to 2:07:30 | 4 | 0.2% |
| 2:07:30 to 2:10:00 | 3 | 0.2% |
| 2:10:00 to 2:12:30 | 4 | 0.2% |
| 2:12:30 to 2:15:00 | 1 | 0.1% |
| 2:15:00 to 2:17:30 | 4 | 0.2% |
| 2:17:30 to 2:20:00 | 3 | 0.2% |
| 2:20:00 to 2:22:30 | 1 | 0.1% |
| 2:22:30 to 2:25:00 | 1 | 0.1% |
| 2:25:00 to 2:27:30 | 1 | 0.1% |
| 2:27:30 to 2:30:00 | 2 | 0.1% |
| 2:30:00 to 2:32:30 | 0 | 0.0% |
| 2:32:30 to 2:35:00 | 1 | 0.1% |
| 2:35:00 to 2:37:30 | 1 | 0.1% |
| 2:37:30 to 2:40:00 | 0 | 0.0% |
| 2:40:00 to 2:42:30 | 1 | 0.1% |
How to read
Each bar is how many finished in that time slot, fastest on the left, men and women together. Green is the fastest 10%; the line is the typical finish.
Or type your name above.
Finish times, Doubles · Wednesday
This chart shows how many athletes finished in each 2.5-minute band, fastest on the left.A field of normal spread: typical 1:21:31, middle half about 1:12:46 to 1:31:07, fastest 10% (green) under 1:05:29.
See the numbers
| Time band | How many | Share |
|---|---|---|
| 52:30 to 55:00 | 4 | 0.2% |
| 55:00 to 57:30 | 12 | 0.7% |
| 57:30 to 1:00:00 | 32 | 1.8% |
| 1:00:00 to 1:02:30 | 42 | 2.3% |
| 1:02:30 to 1:05:00 | 70 | 3.9% |
| 1:05:00 to 1:07:30 | 81 | 4.5% |
| 1:07:30 to 1:10:00 | 98 | 5.5% |
| 1:10:00 to 1:12:30 | 97 | 5.4% |
| 1:12:30 to 1:15:00 | 110 | 6.1% |
| 1:15:00 to 1:17:30 | 135 | 7.5% |
| 1:17:30 to 1:20:00 | 127 | 7.1% |
| 1:20:00 to 1:22:30 | 141 | 7.9% |
| 1:22:30 to 1:25:00 | 127 | 7.1% |
| 1:25:00 to 1:27:30 | 116 | 6.5% |
| 1:27:30 to 1:30:00 | 110 | 6.1% |
| 1:30:00 to 1:32:30 | 93 | 5.2% |
| 1:32:30 to 1:35:00 | 72 | 4.0% |
| 1:35:00 to 1:37:30 | 70 | 3.9% |
| 1:37:30 to 1:40:00 | 41 | 2.3% |
| 1:40:00 to 1:42:30 | 41 | 2.3% |
| 1:42:30 to 1:45:00 | 26 | 1.5% |
| 1:45:00 to 1:47:30 | 25 | 1.4% |
| 1:47:30 to 1:50:00 | 30 | 1.7% |
| 1:50:00 to 1:52:30 | 18 | 1.0% |
| 1:52:30 to 1:55:00 | 15 | 0.8% |
| 1:55:00 to 1:57:30 | 11 | 0.6% |
| 1:57:30 to 2:00:00 | 11 | 0.6% |
| 2:00:00 to 2:02:30 | 5 | 0.3% |
| 2:02:30 to 2:05:00 | 3 | 0.2% |
| 2:05:00 to 2:07:30 | 6 | 0.3% |
| 2:07:30 to 2:10:00 | 5 | 0.3% |
| 2:10:00 to 2:12:30 | 3 | 0.2% |
| 2:12:30 to 2:15:00 | 1 | 0.1% |
| 2:15:00 to 2:17:30 | 4 | 0.2% |
| 2:17:30 to 2:20:00 | 2 | 0.1% |
| 2:20:00 to 2:22:30 | 3 | 0.2% |
| 2:22:30 to 2:25:00 | 1 | 0.1% |
| 2:25:00 to 2:27:30 | 1 | 0.1% |
| 2:27:30 to 2:30:00 | 0 | 0.0% |
| 2:30:00 to 2:32:30 | 0 | 0.0% |
| 2:32:30 to 2:35:00 | 0 | 0.0% |
| 2:35:00 to 2:37:30 | 0 | 0.0% |
| 2:37:30 to 2:40:00 | 0 | 0.0% |
| 2:40:00 to 2:42:30 | 1 | 0.1% |
| 2:42:30 to 2:45:00 | 1 | 0.1% |
How to read
Each bar is how many finished in that time slot, fastest on the left, men and women together. Green is the fastest 10%; the line is the typical finish.
Or type your name above.
Finish times, Doubles · Thursday
This chart shows how many athletes finished in each 2.5-minute band, fastest on the left.A field of normal spread: typical 1:20:05, middle half about 1:11:23 to 1:29:38, fastest 10% (green) under 1:04:48.
See the numbers
| Time band | How many | Share |
|---|---|---|
| 52:30 to 55:00 | 6 | 0.3% |
| 55:00 to 57:30 | 20 | 1.1% |
| 57:30 to 1:00:00 | 44 | 2.4% |
| 1:00:00 to 1:02:30 | 43 | 2.3% |
| 1:02:30 to 1:05:00 | 76 | 4.1% |
| 1:05:00 to 1:07:30 | 90 | 4.9% |
| 1:07:30 to 1:10:00 | 109 | 5.9% |
| 1:10:00 to 1:12:30 | 127 | 6.9% |
| 1:12:30 to 1:15:00 | 107 | 5.8% |
| 1:15:00 to 1:17:30 | 153 | 8.3% |
| 1:17:30 to 1:20:00 | 136 | 7.4% |
| 1:20:00 to 1:22:30 | 124 | 6.8% |
| 1:22:30 to 1:25:00 | 131 | 7.1% |
| 1:25:00 to 1:27:30 | 124 | 6.8% |
| 1:27:30 to 1:30:00 | 100 | 5.5% |
| 1:30:00 to 1:32:30 | 79 | 4.3% |
| 1:32:30 to 1:35:00 | 66 | 3.6% |
| 1:35:00 to 1:37:30 | 75 | 4.1% |
| 1:37:30 to 1:40:00 | 45 | 2.5% |
| 1:40:00 to 1:42:30 | 34 | 1.9% |
| 1:42:30 to 1:45:00 | 33 | 1.8% |
| 1:45:00 to 1:47:30 | 28 | 1.5% |
| 1:47:30 to 1:50:00 | 19 | 1.0% |
| 1:50:00 to 1:52:30 | 18 | 1.0% |
| 1:52:30 to 1:55:00 | 10 | 0.5% |
| 1:55:00 to 1:57:30 | 11 | 0.6% |
| 1:57:30 to 2:00:00 | 4 | 0.2% |
| 2:00:00 to 2:02:30 | 6 | 0.3% |
| 2:02:30 to 2:05:00 | 5 | 0.3% |
| 2:05:00 to 2:07:30 | 4 | 0.2% |
| 2:07:30 to 2:10:00 | 2 | 0.1% |
| 2:10:00 to 2:12:30 | 2 | 0.1% |
| 2:12:30 to 2:15:00 | 0 | 0.0% |
| 2:15:00 to 2:17:30 | 0 | 0.0% |
| 2:17:30 to 2:20:00 | 0 | 0.0% |
| 2:20:00 to 2:22:30 | 0 | 0.0% |
| 2:22:30 to 2:25:00 | 1 | 0.1% |
| 2:25:00 to 2:27:30 | 0 | 0.0% |
| 2:27:30 to 2:30:00 | 1 | 0.1% |
| 2:30:00 to 2:32:30 | 0 | 0.0% |
| 2:32:30 to 2:35:00 | 0 | 0.0% |
| 2:35:00 to 2:37:30 | 1 | 0.1% |
How to read
Each bar is how many finished in that time slot, fastest on the left, men and women together. Green is the fastest 10%; the line is the typical finish.
Or type your name above.
Finish times, Doubles · Friday
This chart shows how many athletes finished in each 2.5-minute band, fastest on the left.A field of normal spread: typical 1:19:13, middle half about 1:09:54 to 1:28:56, fastest 10% (green) under 1:03:57.
See the numbers
| Time band | How many | Share |
|---|---|---|
| 52:30 to 55:00 | 2 | 0.2% |
| 55:00 to 57:30 | 11 | 1.2% |
| 57:30 to 1:00:00 | 31 | 3.3% |
| 1:00:00 to 1:02:30 | 26 | 2.8% |
| 1:02:30 to 1:05:00 | 39 | 4.1% |
| 1:05:00 to 1:07:30 | 53 | 5.6% |
| 1:07:30 to 1:10:00 | 77 | 8.2% |
| 1:10:00 to 1:12:30 | 48 | 5.1% |
| 1:12:30 to 1:15:00 | 63 | 6.7% |
| 1:15:00 to 1:17:30 | 86 | 9.1% |
| 1:17:30 to 1:20:00 | 55 | 5.8% |
| 1:20:00 to 1:22:30 | 78 | 8.3% |
| 1:22:30 to 1:25:00 | 62 | 6.6% |
| 1:25:00 to 1:27:30 | 53 | 5.6% |
| 1:27:30 to 1:30:00 | 42 | 4.4% |
| 1:30:00 to 1:32:30 | 37 | 3.9% |
| 1:32:30 to 1:35:00 | 26 | 2.8% |
| 1:35:00 to 1:37:30 | 31 | 3.3% |
| 1:37:30 to 1:40:00 | 21 | 2.2% |
| 1:40:00 to 1:42:30 | 19 | 2.0% |
| 1:42:30 to 1:45:00 | 16 | 1.7% |
| 1:45:00 to 1:47:30 | 15 | 1.6% |
| 1:47:30 to 1:50:00 | 8 | 0.8% |
| 1:50:00 to 1:52:30 | 10 | 1.1% |
| 1:52:30 to 1:55:00 | 10 | 1.1% |
| 1:55:00 to 1:57:30 | 6 | 0.6% |
| 1:57:30 to 2:00:00 | 2 | 0.2% |
| 2:00:00 to 2:02:30 | 4 | 0.4% |
| 2:02:30 to 2:05:00 | 1 | 0.1% |
| 2:05:00 to 2:07:30 | 3 | 0.3% |
| 2:07:30 to 2:10:00 | 1 | 0.1% |
| 2:10:00 to 2:12:30 | 1 | 0.1% |
| 2:12:30 to 2:15:00 | 2 | 0.2% |
| 2:15:00 to 2:17:30 | 1 | 0.1% |
| 2:17:30 to 2:20:00 | 1 | 0.1% |
| 2:20:00 to 2:22:30 | 2 | 0.2% |
| 2:22:30 to 2:25:00 | 0 | 0.0% |
| 2:25:00 to 2:27:30 | 0 | 0.0% |
| 2:27:30 to 2:30:00 | 0 | 0.0% |
| 2:30:00 to 2:32:30 | 0 | 0.0% |
| 2:32:30 to 2:35:00 | 0 | 0.0% |
| 2:35:00 to 2:37:30 | 0 | 0.0% |
| 2:37:30 to 2:40:00 | 0 | 0.0% |
| 2:40:00 to 2:42:30 | 0 | 0.0% |
| 2:42:30 to 2:45:00 | 1 | 0.1% |
How to read
Each bar is how many finished in that time slot, fastest on the left, men and women together. Green is the fastest 10%; the line is the typical finish.
Or type your name above.
Finish times, Doubles · Saturday
This chart shows how many athletes finished in each 2.5-minute band, fastest on the left.A field of normal spread: typical 1:20:31, middle half about 1:12:12 to 1:29:29, fastest 10% (green) under 1:05:27.
See the numbers
| Time band | How many | Share |
|---|---|---|
| 52:30 to 55:00 | 1 | 0.1% |
| 55:00 to 57:30 | 10 | 0.9% |
| 57:30 to 1:00:00 | 18 | 1.6% |
| 1:00:00 to 1:02:30 | 28 | 2.4% |
| 1:02:30 to 1:05:00 | 48 | 4.1% |
| 1:05:00 to 1:07:30 | 61 | 5.3% |
| 1:07:30 to 1:10:00 | 58 | 5.0% |
| 1:10:00 to 1:12:30 | 74 | 6.4% |
| 1:12:30 to 1:15:00 | 95 | 8.2% |
| 1:15:00 to 1:17:30 | 92 | 8.0% |
| 1:17:30 to 1:20:00 | 74 | 6.4% |
| 1:20:00 to 1:22:30 | 98 | 8.5% |
| 1:22:30 to 1:25:00 | 82 | 7.1% |
| 1:25:00 to 1:27:30 | 82 | 7.1% |
| 1:27:30 to 1:30:00 | 59 | 5.1% |
| 1:30:00 to 1:32:30 | 46 | 4.0% |
| 1:32:30 to 1:35:00 | 41 | 3.5% |
| 1:35:00 to 1:37:30 | 48 | 4.1% |
| 1:37:30 to 1:40:00 | 25 | 2.2% |
| 1:40:00 to 1:42:30 | 20 | 1.7% |
| 1:42:30 to 1:45:00 | 20 | 1.7% |
| 1:45:00 to 1:47:30 | 21 | 1.8% |
| 1:47:30 to 1:50:00 | 19 | 1.6% |
| 1:50:00 to 1:52:30 | 9 | 0.8% |
| 1:52:30 to 1:55:00 | 4 | 0.3% |
| 1:55:00 to 1:57:30 | 9 | 0.8% |
| 1:57:30 to 2:00:00 | 2 | 0.2% |
| 2:00:00 to 2:02:30 | 3 | 0.3% |
| 2:02:30 to 2:05:00 | 1 | 0.1% |
| 2:05:00 to 2:07:30 | 1 | 0.1% |
| 2:07:30 to 2:10:00 | 2 | 0.2% |
| 2:10:00 to 2:12:30 | 0 | 0.0% |
| 2:12:30 to 2:15:00 | 2 | 0.2% |
| 2:15:00 to 2:17:30 | 1 | 0.1% |
| 2:17:30 to 2:20:00 | 1 | 0.1% |
| 2:20:00 to 2:22:30 | 1 | 0.1% |
| 2:22:30 to 2:25:00 | 0 | 0.0% |
| 2:25:00 to 2:27:30 | 0 | 0.0% |
| 2:27:30 to 2:30:00 | 0 | 0.0% |
| 2:30:00 to 2:32:30 | 0 | 0.0% |
| 2:32:30 to 2:35:00 | 0 | 0.0% |
| 2:35:00 to 2:37:30 | 0 | 0.0% |
| 2:37:30 to 2:40:00 | 0 | 0.0% |
| 2:40:00 to 2:42:30 | 0 | 0.0% |
| 2:42:30 to 2:45:00 | 0 | 0.0% |
| 2:45:00 to 2:47:30 | 0 | 0.0% |
| 2:47:30 to 2:50:00 | 0 | 0.0% |
| 2:50:00 to 2:52:30 | 0 | 0.0% |
| 2:52:30 to 2:55:00 | 1 | 0.1% |
How to read
Each bar is how many finished in that time slot, fastest on the left, men and women together. Green is the fastest 10%; the line is the typical finish.
Or type your name above.
Finish times, Doubles · Sunday
This chart shows how many athletes finished in each 2.5-minute band, fastest on the left.A widely spread field: typical 1:21:06, middle half about 1:10:33 to 1:32:33, fastest 10% (green) under 1:03:11.
See the numbers
| Time band | How many | Share |
|---|---|---|
| 47:30 to 50:00 | 1 | 0.0% |
| 50:00 to 52:30 | 3 | 0.1% |
| 52:30 to 55:00 | 17 | 0.6% |
| 55:00 to 57:30 | 28 | 1.1% |
| 57:30 to 1:00:00 | 74 | 2.8% |
| 1:00:00 to 1:02:30 | 109 | 4.1% |
| 1:02:30 to 1:05:00 | 119 | 4.5% |
| 1:05:00 to 1:07:30 | 126 | 4.8% |
| 1:07:30 to 1:10:00 | 152 | 5.7% |
| 1:10:00 to 1:12:30 | 151 | 5.7% |
| 1:12:30 to 1:15:00 | 166 | 6.3% |
| 1:15:00 to 1:17:30 | 149 | 5.6% |
| 1:17:30 to 1:20:00 | 161 | 6.1% |
| 1:20:00 to 1:22:30 | 163 | 6.2% |
| 1:22:30 to 1:25:00 | 153 | 5.8% |
| 1:25:00 to 1:27:30 | 155 | 5.9% |
| 1:27:30 to 1:30:00 | 133 | 5.0% |
| 1:30:00 to 1:32:30 | 124 | 4.7% |
| 1:32:30 to 1:35:00 | 119 | 4.5% |
| 1:35:00 to 1:37:30 | 104 | 3.9% |
| 1:37:30 to 1:40:00 | 79 | 3.0% |
| 1:40:00 to 1:42:30 | 59 | 2.2% |
| 1:42:30 to 1:45:00 | 66 | 2.5% |
| 1:45:00 to 1:47:30 | 55 | 2.1% |
| 1:47:30 to 1:50:00 | 32 | 1.2% |
| 1:50:00 to 1:52:30 | 25 | 0.9% |
| 1:52:30 to 1:55:00 | 32 | 1.2% |
| 1:55:00 to 1:57:30 | 24 | 0.9% |
| 1:57:30 to 2:00:00 | 13 | 0.5% |
| 2:00:00 to 2:02:30 | 17 | 0.6% |
| 2:02:30 to 2:05:00 | 6 | 0.2% |
| 2:05:00 to 2:07:30 | 4 | 0.2% |
| 2:07:30 to 2:10:00 | 5 | 0.2% |
| 2:10:00 to 2:12:30 | 4 | 0.2% |
| 2:12:30 to 2:15:00 | 4 | 0.2% |
| 2:15:00 to 2:17:30 | 3 | 0.1% |
| 2:17:30 to 2:20:00 | 5 | 0.2% |
| 2:20:00 to 2:22:30 | 2 | 0.1% |
| 2:22:30 to 2:25:00 | 3 | 0.1% |
| 2:25:00 to 2:27:30 | 1 | 0.0% |
| 2:27:30 to 2:30:00 | 0 | 0.0% |
| 2:30:00 to 2:32:30 | 1 | 0.0% |
| 2:32:30 to 2:35:00 | 0 | 0.0% |
| 2:35:00 to 2:37:30 | 0 | 0.0% |
| 2:37:30 to 2:40:00 | 1 | 0.0% |
How to read
Each bar is how many finished in that time slot, fastest on the left, men and women together. Green is the fastest 10%; the line is the typical finish.
Or type your name above.
Finish times, Pro · Friday
This chart shows how many athletes finished in each 2.5-minute band, fastest on the left.A field of normal spread: typical 1:18:16, middle half about 1:09:49 to 1:28:56, fastest 10% (green) under 1:03:39.
See the numbers
| Time band | How many | Share |
|---|---|---|
| 55:00 to 57:30 | 10 | 1.0% |
| 57:30 to 1:00:00 | 21 | 2.2% |
| 1:00:00 to 1:02:30 | 36 | 3.7% |
| 1:02:30 to 1:05:00 | 56 | 5.8% |
| 1:05:00 to 1:07:30 | 48 | 4.9% |
| 1:07:30 to 1:10:00 | 78 | 8.0% |
| 1:10:00 to 1:12:30 | 65 | 6.7% |
| 1:12:30 to 1:15:00 | 75 | 7.7% |
| 1:15:00 to 1:17:30 | 76 | 7.8% |
| 1:17:30 to 1:20:00 | 62 | 6.4% |
| 1:20:00 to 1:22:30 | 62 | 6.4% |
| 1:22:30 to 1:25:00 | 56 | 5.8% |
| 1:25:00 to 1:27:30 | 59 | 6.1% |
| 1:27:30 to 1:30:00 | 45 | 4.6% |
| 1:30:00 to 1:32:30 | 37 | 3.8% |
| 1:32:30 to 1:35:00 | 40 | 4.1% |
| 1:35:00 to 1:37:30 | 23 | 2.4% |
| 1:37:30 to 1:40:00 | 18 | 1.8% |
| 1:40:00 to 1:42:30 | 22 | 2.3% |
| 1:42:30 to 1:45:00 | 24 | 2.5% |
| 1:45:00 to 1:47:30 | 11 | 1.1% |
| 1:47:30 to 1:50:00 | 7 | 0.7% |
| 1:50:00 to 1:52:30 | 10 | 1.0% |
| 1:52:30 to 1:55:00 | 8 | 0.8% |
| 1:55:00 to 1:57:30 | 2 | 0.2% |
| 1:57:30 to 2:00:00 | 2 | 0.2% |
| 2:00:00 to 2:02:30 | 4 | 0.4% |
| 2:02:30 to 2:05:00 | 5 | 0.5% |
| 2:05:00 to 2:07:30 | 1 | 0.1% |
| 2:07:30 to 2:10:00 | 1 | 0.1% |
| 2:10:00 to 2:12:30 | 2 | 0.2% |
| 2:12:30 to 2:15:00 | 0 | 0.0% |
| 2:15:00 to 2:17:30 | 1 | 0.1% |
| 2:17:30 to 2:20:00 | 1 | 0.1% |
| 2:20:00 to 2:22:30 | 0 | 0.0% |
| 2:22:30 to 2:25:00 | 0 | 0.0% |
| 2:25:00 to 2:27:30 | 1 | 0.1% |
| 2:27:30 to 2:30:00 | 0 | 0.0% |
| 2:30:00 to 2:32:30 | 0 | 0.0% |
| 2:32:30 to 2:35:00 | 0 | 0.0% |
| 2:35:00 to 2:37:30 | 1 | 0.1% |
| 2:37:30 to 2:40:00 | 1 | 0.1% |
| 2:40:00 to 2:42:30 | 0 | 0.0% |
| 2:42:30 to 2:45:00 | 0 | 0.0% |
| 2:45:00 to 2:47:30 | 0 | 0.0% |
| 2:47:30 to 2:50:00 | 0 | 0.0% |
| 2:50:00 to 2:52:30 | 0 | 0.0% |
| 2:52:30 to 2:55:00 | 0 | 0.0% |
| 2:55:00 to 2:57:30 | 0 | 0.0% |
| 2:57:30 to 3:00:00 | 0 | 0.0% |
| 3:00:00 to 3:02:30 | 0 | 0.0% |
| 3:02:30 to 3:05:00 | 1 | 0.1% |
| 3:05:00 to 3:07:30 | 1 | 0.1% |
How to read
Each bar is how many finished in that time slot, fastest on the left, men and women together. Green is the fastest 10%; the line is the typical finish.
| # | Athlete | Age group | Time | |
|---|---|---|---|---|
| 1 | Scott Bayvel RSA | 35-39 | 55:48 | |
| 2 | George Martindale GBR | 30-34 | 55:48 | |
| 3 | Marc Dean GBR | 35-39 | 55:53 | |
| 4 | Jacques Hladkyj GBR | 25-29 | 55:59 | |
| 5 | Jesse Owen GBR | 30-34 | 56:05 | |
| 6 | Toby Wilson GBR | 25-29 | 56:24 | |
| 7 | Joel Roura GBR | 25-29 | 56:51 | |
| 8 | Fergus Jenkins GBR | 25-29 | 57:07 | |
| 9 | Jess Price - Owen GBR | 35-39 | 57:22 | |
| 10 | Luke Buckland GBR | 16-24 | 57:26 | |
| 11 | Elliot Giles GBR | 30-34 | 57:48 | |
| 12 | Matthew Plowman GBR | 30-34 | 57:56 | |
| 13 | Tom Jones GBR | 30-34 | 58:03 | |
| 14 | Dan Jackson GBR | 30-34 | 58:09 | |
| 15 | Lucas Parker GBR | 16-24 | 58:11 | |
| 16 | Ben Sheppard GBR | 30-34 | 58:14 | |
| 17 | Oli Fricker GBR | 30-34 | 58:18 | |
| 18 | Maciej Wegorzewski POL | 30-34 | 58:39 | |
| 19 | Dan Nota GBR | 25-29 | 58:43 | |
| 20 | Kieran Higgs GBR | 25-29 | 58:46 | |
| 21 | Victor Cambaud-Pinon FRA | 25-29 | 58:49 | |
| 22 | Lauren Armstrong GBR | 35-39 | 58:50 | |
| 23 | Daniel Matsuzaka JPN | 25-29 | 58:54 | |
| 24 | Ryan Gibson GBR | 30-34 | 59:03 | |
| 25 | Andrew Duckham GBR | 35-39 | 59:29 | |
| 26 | Jack Lawrence GBR | 30-34 | 59:34 | |
| 27 | Bodger Rees GBR | 35-39 | 59:35 | |
| 28 | Brendan Pearson GBR | 25-29 | 59:38 | |
| 29 | Craig Murphy GBR | 30-34 | 59:50 | |
| 30 | Daniel Keane GBR | 25-29 | 59:50 | |
| 31 | Liam Scott GBR | 30-34 | 59:57 | |
| 32 | Kristofer McSherry GBR | 30-34 | 1:00:10 | |
| 33 | Alexander Neville GBR | 25-29 | 1:00:22 | |
| 34 | Rhys Dent GBR | 25-29 | 1:00:23 | |
| 35 | Gavin Magner GBR | 30-34 | 1:00:26 | |
| 36 | Jakub Riedel POL | 16-24 | 1:00:27 | |
| 37 | Lucy Davis GBR | 25-29 | 1:00:36 | |
| 38 | Darren Ritchie GBR | 40-44 | 1:00:43 | |
| 39 | Jack Waymark GBR | 25-29 | 1:00:53 | |
| 40 | Lucy Procter GBR | 16-24 | 1:00:55 | |
| 41 | Lewis Nagington GBR | 16-24 | 1:00:57 | |
| 42 | Joe Skipper GBR | 35-39 | 1:01:02 | |
| 43 | Amy Walsh GBR | 16-24 | 1:01:02 | |
| 44 | Toby Roberts GBR | 30-34 | 1:01:05 | |
| 45 | Steven Beattie GBR | 35-39 | 1:01:06 | |
| 46 | Ethan Smith GBR | 30-34 | 1:01:09 | |
| 47 | Jake Deaner GBR | 16-24 | 1:01:10 | |
| 48 | Joshua Moody GBR | 30-34 | 1:01:17 | |
| 49 | Evan Galloway GBR | 30-34 | 1:01:26 | |
| 50 | Ryan Clift GBR | 30-34 | 1:01:28 |
Or type your name above.
Finish times, Pro Doubles · Saturday
This chart shows how many athletes finished in each 2.5-minute band, fastest on the left.A field of normal spread: typical 1:08:21, middle half about 1:01:37 to 1:16:31, fastest 10% (green) under 57:28.
See the numbers
| Time band | How many | Share |
|---|---|---|
| 47:30 to 50:00 | 1 | 0.1% |
| 50:00 to 52:30 | 16 | 2.1% |
| 52:30 to 55:00 | 22 | 2.8% |
| 55:00 to 57:30 | 40 | 5.2% |
| 57:30 to 1:00:00 | 66 | 8.5% |
| 1:00:00 to 1:02:30 | 76 | 9.8% |
| 1:02:30 to 1:05:00 | 77 | 9.9% |
| 1:05:00 to 1:07:30 | 73 | 9.4% |
| 1:07:30 to 1:10:00 | 68 | 8.8% |
| 1:10:00 to 1:12:30 | 59 | 7.6% |
| 1:12:30 to 1:15:00 | 50 | 6.4% |
| 1:15:00 to 1:17:30 | 56 | 7.2% |
| 1:17:30 to 1:20:00 | 37 | 4.8% |
| 1:20:00 to 1:22:30 | 33 | 4.3% |
| 1:22:30 to 1:25:00 | 24 | 3.1% |
| 1:25:00 to 1:27:30 | 20 | 2.6% |
| 1:27:30 to 1:30:00 | 9 | 1.2% |
| 1:30:00 to 1:32:30 | 14 | 1.8% |
| 1:32:30 to 1:35:00 | 12 | 1.5% |
| 1:35:00 to 1:37:30 | 8 | 1.0% |
| 1:37:30 to 1:40:00 | 4 | 0.5% |
| 1:40:00 to 1:42:30 | 2 | 0.3% |
| 1:42:30 to 1:45:00 | 2 | 0.3% |
| 1:45:00 to 1:47:30 | 0 | 0.0% |
| 1:47:30 to 1:50:00 | 3 | 0.4% |
| 1:50:00 to 1:52:30 | 0 | 0.0% |
| 1:52:30 to 1:55:00 | 2 | 0.3% |
| 1:55:00 to 1:57:30 | 2 | 0.3% |
How to read
Each bar is how many finished in that time slot, fastest on the left, men and women together. Green is the fastest 10%; the line is the typical finish.
Or type your name above.
Finish times, Relay · Friday
This chart shows how many athletes finished in each 2.5-minute band, fastest on the left.A widely spread field with a long slow tail: typical 1:13:47, middle half about 1:06:03 to 1:25:25, fastest 10% (green) under 59:22.
See the numbers
| Time band | How many | Share |
|---|---|---|
| 50:00 to 52:30 | 4 | 1.7% |
| 52:30 to 55:00 | 5 | 2.1% |
| 55:00 to 57:30 | 7 | 2.9% |
| 57:30 to 1:00:00 | 12 | 5.0% |
| 1:00:00 to 1:02:30 | 13 | 5.5% |
| 1:02:30 to 1:05:00 | 13 | 5.5% |
| 1:05:00 to 1:07:30 | 13 | 5.5% |
| 1:07:30 to 1:10:00 | 21 | 8.8% |
| 1:10:00 to 1:12:30 | 21 | 8.8% |
| 1:12:30 to 1:15:00 | 17 | 7.1% |
| 1:15:00 to 1:17:30 | 14 | 5.9% |
| 1:17:30 to 1:20:00 | 13 | 5.5% |
| 1:20:00 to 1:22:30 | 12 | 5.0% |
| 1:22:30 to 1:25:00 | 12 | 5.0% |
| 1:25:00 to 1:27:30 | 9 | 3.8% |
| 1:27:30 to 1:30:00 | 8 | 3.4% |
| 1:30:00 to 1:32:30 | 6 | 2.5% |
| 1:32:30 to 1:35:00 | 4 | 1.7% |
| 1:35:00 to 1:37:30 | 11 | 4.6% |
| 1:37:30 to 1:40:00 | 6 | 2.5% |
| 1:40:00 to 1:42:30 | 2 | 0.8% |
| 1:42:30 to 1:45:00 | 2 | 0.8% |
| 1:45:00 to 1:47:30 | 2 | 0.8% |
| 1:47:30 to 1:50:00 | 6 | 2.5% |
| 1:50:00 to 1:52:30 | 1 | 0.4% |
| 1:52:30 to 1:55:00 | 0 | 0.0% |
| 1:55:00 to 1:57:30 | 1 | 0.4% |
| 1:57:30 to 2:00:00 | 2 | 0.8% |
| 2:00:00 to 2:02:30 | 0 | 0.0% |
| 2:02:30 to 2:05:00 | 0 | 0.0% |
| 2:05:00 to 2:07:30 | 0 | 0.0% |
| 2:07:30 to 2:10:00 | 1 | 0.4% |
How to read
Each bar is how many finished in that time slot, fastest on the left, men and women together. Green is the fastest 10%; the line is the typical finish.
Or type your name above.
16 finishers in so far: too few for a typical time, so here is the list.
| # | Athlete | Age group | Time | |
|---|---|---|---|---|
| 1 | Sam Hill GBR | Seated With Hip Function | 1:07:47 | |
| 2 | Ryan Watson GBR | Lower Limb Minor | 1:09:08 | |
| 3 | James Roe GBR | Visual Impairment | 1:10:05 | |
| 4 | Danny Purdie GBR | Seated With Hip Function | 1:10:22 | |
| 5 | Sam Scadeng GBR | Deaf Impairment | 1:11:34 | |
| 6 | Kare Adenegan GBR | Seated With Hip Function | 1:20:04 | |
| 7 | Krissy Moulder GBR | Seated With Hip Function | 1:22:55 | |
| 8 | Donatas Pocesiunas LTU | Deaf Impairment | 1:29:17 | |
| 9 | Abu Salloo GBR | Deaf Impairment | 1:29:38 | |
| 10 | claire boparai GBR | Neurological Minor | 1:36:27 | |
| 11 | Christopher Frith GBR | Deaf Impairment | 1:40:52 | |
| 12 | Alex Burlison GBR | Deaf Impairment | 1:41:17 | |
| 13 | Tom Colton IRL | Deaf Impairment | 2:04:06 | |
| 14 | William Tesar GBR | Deaf Impairment | 2:07:10 | |
| 15 | Adeenah Patel GBR | Neurological Moderate | 2:09:04 | |
| 16 | Edward Sullivan GBR | Neurological Minor | 2:11:53 |
12 finishers in so far: too few for a typical time, so here is the list.
| # | Athlete | Age group | Time | |
|---|---|---|---|---|
| 1 | Riley Desouza GBR | Neurological Major | 54:32 | |
| 2 | Mary FitzGerald IRL | Short Statue Impairment | 1:01:18 | |
| 3 | Sophie Wilson GBR | Seated Without Core Function | 1:16:20 | |
| 4 | Chris Goodwin GBR | Visual Impairment | 1:23:50 | |
| 5 | Rachael Snell GBR | Neurological Minor | 1:31:51 | |
| 6 | Coral Farrell GBR | Lower Limb Minor | 1:33:09 | |
| 7 | David Russon GBR | Upper Limb Minor | 1:38:04 | |
| 8 | Tom Dorman GBR | Lower Limb Major | 1:39:42 | |
| 9 | Sean Nolan IRL | Upper Limb Minor | 1:41:22 | |
| 10 | Dale Warley GBR | Deaf Impairment | 1:41:32 | |
| 11 | Adam Siskin GBR | Neurological Moderate | 1:44:07 | |
| 12 | Lauren Whitehouse GBR | Upper Limb Minor | 1:59:25 |
18 finishers in so far: too few for a typical time, so here is the list.
| # | Athlete | Age group | Time | |
|---|---|---|---|---|
| 1 | Anthony Bryan GBR | Neurological Major | 51:07 | |
| 2 | Jac Sheehan GBR | Seated With Hip Function | 1:04:43 | |
| 3 | Bronte Barratt GBR | Neurological Minor | 1:11:33 | |
| 4 | Ben Triglia-Poulton GBR | Seated Without Hip Function | 1:11:55 | |
| 5 | Saffron Cresswell GBR | Seated Without Core Function | 1:17:50 | |
| 6 | Rhian Morris GBR | Neurological Minor | 1:19:41 | |
| 7 | Paul Walmsley GBR | Seated Without Hip Function | 1:21:59 | |
| 8 | Martha Sharland GBR | Neurological Major | 1:24:48 | |
| 9 | Chris Feeley GBR | Seated Without Hip Function | 1:26:09 | |
| 10 | Maddie Gordon GBR | Seated With Hip Function | 1:29:36 | |
| 11 | Paul Mackrill GBR | Neurological Moderate | 1:38:29 | |
| 12 | Emma Montgomery-Grimes GBR | Neurological Minor | 1:44:02 | |
| 13 | Luke Rogers GBR | Lower Limb Minor | 1:44:36 | |
| 14 | Roshni Hainsworth GBR | Neurological Minor | 1:46:47 | |
| 15 | Kate Haslam GBR | Neurological Minor | 1:47:10 | |
| 16 | DAN RUSH GBR | Lower Limb Major | 1:47:35 | |
| 17 | Emilyn Hutchinson GBR | Neurological Moderate | 1:55:25 | |
| 18 | Chris Evans GBR | Upper Limb Major | 1:59:05 |
15 finishers in so far: too few for a typical time, so here is the list.
| # | Athlete | Age group | Time | |
|---|---|---|---|---|
| 1 | Laura Pointer GBR | Neurological Major | 55:53 | |
| 2 | Harry Crooke GBR | Neurological Major | 1:11:07 | |
| 3 | Katie Cooper GBR | Upper Limb Minor | 1:17:37 | |
| 4 | Tamzin Tillcock GBR | Neurological Moderate | 1:19:26 | |
| 5 | Liam Brothwood GBR | Upper Limb Major | 1:24:09 | |
| 6 | Priti Merchant GBR | Neurological Moderate | 1:25:50 | |
| 7 | Christopher Woods GBR | Neurological Minor | 1:27:36 | |
| 8 | Natalie South-Law GBR | Seated With Hip Function | 1:27:38 | |
| 9 | NICK MARKHAM GBR | Seated Without Hip Function | 1:28:53 | |
| 10 | Megan Everett GBR | Deaf Impairment | 1:43:11 | |
| 11 | Molly Clist GBR | Visual Impairment | 1:43:52 | |
| 12 | David Wetherill GBR | Lower Limb Major | 1:45:58 | |
| 13 | David Morris GBR | Deaf Impairment | 1:47:14 | |
| 14 | Thomas Williams GBR | Neurological Moderate | 1:49:29 | |
| 15 | Simon Sorkin ENG | Neurological Minor | 3:42:39 |
8 finishers in so far: too few for a typical time, so here is the list.
| # | Athlete | Age group | Time | |
|---|---|---|---|---|
| 1 | Sean Bailey GBR | Neurological Major | 58:58 | |
| 2 | Tom Green GBR | Seated Without Hip Function | 1:03:30 | |
| 3 | Robert Dyjak POL | Upper Limb Minor | 1:04:16 | |
| 4 | Richard Cooke GBR | Seated With Hip Function | 1:07:54 | |
| 5 | Nicholas Gray GBR | Neurological Major | 1:13:04 | |
| 6 | Steven Gotobed GBR | Neurological Minor | 1:17:37 | |
| 7 | Toby Fitzpatrick GBR | Visual Impairment | 1:18:48 | |
| 8 | Matthew Timms GBR | Lower Limb Minor | 1:54:19 |
7 finishers in so far: too few for a typical time, so here is the list.
| # | Athlete | Age group | Time | |
|---|---|---|---|---|
| 1 | Isla McCutcheon GBR | Neurological Moderate | 1:14:42 | |
| 2 | Louise Archer GBR | Neurological Minor | 1:18:58 | |
| 3 | Charlotte Green GBR | Neurological Moderate | 1:30:00 | |
| 4 | Faith Fordham GBR | Neurological Moderate | 1:32:08 | |
| 5 | Elle Dempsey GBR | Seated With Hip Function | 1:57:04 | |
| 6 | Helen Goalby GBR | Lower Limb Major | 2:12:22 | |
| 7 | Hannah Booth GBR | Seated With Hip Function | 2:13:29 |
The times to beat at Birmingham
This chart shows how many athletes finished in each 2.5-minute band, fastest on the left.A field of normal spread: typical 1:25:13, middle half about 1:15:48 to 1:36:43, fastest 10% (green) under 1:08:48.The marked line is fastest 25%: 1:15:47. The busiest band was 1:17:30 to 1:20:00.
See the numbers
| Time band | How many | Share |
|---|---|---|
| 52:30 to 55:00 | 1 | 0.0% |
| 55:00 to 57:30 | 6 | 0.2% |
| 57:30 to 1:00:00 | 21 | 0.5% |
| 1:00:00 to 1:02:30 | 54 | 1.4% |
| 1:02:30 to 1:05:00 | 98 | 2.5% |
| 1:05:00 to 1:07:30 | 140 | 3.5% |
| 1:07:30 to 1:10:00 | 179 | 4.5% |
| 1:10:00 to 1:12:30 | 161 | 4.1% |
| 1:12:30 to 1:15:00 | 240 | 6.1% |
| 1:15:00 to 1:17:30 | 268 | 6.8% |
| 1:17:30 to 1:20:00 | 299 | 7.6% |
| 1:20:00 to 1:22:30 | 208 | 5.3% |
| 1:22:30 to 1:25:00 | 274 | 6.9% |
| 1:25:00 to 1:27:30 | 240 | 6.1% |
| 1:27:30 to 1:30:00 | 259 | 6.6% |
| 1:30:00 to 1:32:30 | 202 | 5.1% |
| 1:32:30 to 1:35:00 | 190 | 4.8% |
| 1:35:00 to 1:37:30 | 173 | 4.4% |
| 1:37:30 to 1:40:00 | 125 | 3.2% |
| 1:40:00 to 1:42:30 | 119 | 3.0% |
| 1:42:30 to 1:45:00 | 104 | 2.6% |
| 1:45:00 to 1:47:30 | 89 | 2.3% |
| 1:47:30 to 1:50:00 | 73 | 1.9% |
| 1:50:00 to 1:52:30 | 74 | 1.9% |
| 1:52:30 to 1:55:00 | 48 | 1.2% |
| 1:55:00 to 1:57:30 | 55 | 1.4% |
| 1:57:30 to 2:00:00 | 33 | 0.8% |
| 2:00:00 to 2:02:30 | 34 | 0.9% |
| 2:02:30 to 2:05:00 | 30 | 0.8% |
| 2:05:00 to 2:07:30 | 23 | 0.6% |
| 2:07:30 to 2:10:00 | 16 | 0.4% |
| 2:10:00 to 2:12:30 | 18 | 0.5% |
| 2:12:30 to 2:15:00 | 19 | 0.5% |
| 2:15:00 to 2:17:30 | 9 | 0.2% |
| 2:17:30 to 2:20:00 | 7 | 0.2% |
| 2:20:00 to 2:22:30 | 5 | 0.1% |
| 2:22:30 to 2:25:00 | 8 | 0.2% |
| 2:25:00 to 2:27:30 | 5 | 0.1% |
| 2:27:30 to 2:30:00 | 0 | 0.0% |
| 2:30:00 to 2:32:30 | 3 | 0.1% |
| 2:32:30 to 2:35:00 | 5 | 0.1% |
| 2:35:00 to 2:37:30 | 5 | 0.1% |
| 2:37:30 to 2:40:00 | 3 | 0.1% |
| 2:40:00 to 2:42:30 | 3 | 0.1% |
| 2:42:30 to 2:45:00 | 4 | 0.1% |
| 2:45:00 to 2:47:30 | 3 | 0.1% |
| 2:47:30 to 2:50:00 | 0 | 0.0% |
| 2:50:00 to 2:52:30 | 2 | 0.1% |
| 2:52:30 to 2:55:00 | 2 | 0.1% |
| 2:55:00 to 2:57:30 | 0 | 0.0% |
| 2:57:30 to 3:00:00 | 1 | 0.0% |
| 3:00:00 to 3:02:30 | 1 | 0.0% |
| 3:02:30 to 3:05:00 | 1 | 0.0% |
| 3:05:00 to 3:07:30 | 1 | 0.0% |
| 3:07:30 to 3:10:00 | 0 | 0.0% |
| 3:10:00 to 3:12:30 | 1 | 0.0% |
| 3:12:30 to 3:15:00 | 0 | 0.0% |
| 3:15:00 to 3:17:30 | 0 | 0.0% |
| 3:17:30 to 3:20:00 | 3 | 0.1% |
This chart shows how many athletes finished in each 2.5-minute band, fastest on the left.A field of normal spread with a long slow tail: typical 1:33:26, middle half about 1:24:21 to 1:46:13, fastest 10% (green) under 1:17:40.The marked line is fastest 25%: 1:24:20. The busiest band was 1:27:30 to 1:30:00.
See the numbers
| Time band | How many | Share |
|---|---|---|
| 1:00:00 to 1:02:30 | 1 | 0.1% |
| 1:02:30 to 1:05:00 | 2 | 0.1% |
| 1:05:00 to 1:07:30 | 8 | 0.4% |
| 1:07:30 to 1:10:00 | 26 | 1.3% |
| 1:10:00 to 1:12:30 | 41 | 2.1% |
| 1:12:30 to 1:15:00 | 51 | 2.6% |
| 1:15:00 to 1:17:30 | 64 | 3.3% |
| 1:17:30 to 1:20:00 | 87 | 4.4% |
| 1:20:00 to 1:22:30 | 119 | 6.1% |
| 1:22:30 to 1:25:00 | 122 | 6.2% |
| 1:25:00 to 1:27:30 | 128 | 6.5% |
| 1:27:30 to 1:30:00 | 148 | 7.6% |
| 1:30:00 to 1:32:30 | 133 | 6.8% |
| 1:32:30 to 1:35:00 | 131 | 6.7% |
| 1:35:00 to 1:37:30 | 123 | 6.3% |
| 1:37:30 to 1:40:00 | 83 | 4.2% |
| 1:40:00 to 1:42:30 | 102 | 5.2% |
| 1:42:30 to 1:45:00 | 66 | 3.4% |
| 1:45:00 to 1:47:30 | 67 | 3.4% |
| 1:47:30 to 1:50:00 | 63 | 3.2% |
| 1:50:00 to 1:52:30 | 68 | 3.5% |
| 1:52:30 to 1:55:00 | 38 | 1.9% |
| 1:55:00 to 1:57:30 | 35 | 1.8% |
| 1:57:30 to 2:00:00 | 46 | 2.4% |
| 2:00:00 to 2:02:30 | 28 | 1.4% |
| 2:02:30 to 2:05:00 | 30 | 1.5% |
| 2:05:00 to 2:07:30 | 26 | 1.3% |
| 2:07:30 to 2:10:00 | 15 | 0.8% |
| 2:10:00 to 2:12:30 | 12 | 0.6% |
| 2:12:30 to 2:15:00 | 13 | 0.7% |
| 2:15:00 to 2:17:30 | 20 | 1.0% |
| 2:17:30 to 2:20:00 | 8 | 0.4% |
| 2:20:00 to 2:22:30 | 7 | 0.4% |
| 2:22:30 to 2:25:00 | 4 | 0.2% |
| 2:25:00 to 2:27:30 | 6 | 0.3% |
| 2:27:30 to 2:30:00 | 3 | 0.2% |
| 2:30:00 to 2:32:30 | 5 | 0.3% |
| 2:32:30 to 2:35:00 | 4 | 0.2% |
| 2:35:00 to 2:37:30 | 0 | 0.0% |
| 2:37:30 to 2:40:00 | 7 | 0.4% |
| 2:40:00 to 2:42:30 | 4 | 0.2% |
| 2:42:30 to 2:45:00 | 4 | 0.2% |
| 2:45:00 to 2:47:30 | 3 | 0.2% |
| 2:47:30 to 2:50:00 | 1 | 0.1% |
| 2:50:00 to 2:52:30 | 1 | 0.1% |
| 2:52:30 to 2:55:00 | 0 | 0.0% |
| 2:55:00 to 2:57:30 | 0 | 0.0% |
| 2:57:30 to 3:00:00 | 1 | 0.1% |
| 3:00:00 to 3:02:30 | 0 | 0.0% |
| 3:02:30 to 3:05:00 | 0 | 0.0% |
| 3:05:00 to 3:07:30 | 0 | 0.0% |
| 3:07:30 to 3:10:00 | 1 | 0.1% |
| 3:10:00 to 3:12:30 | 0 | 0.0% |
| 3:12:30 to 3:15:00 | 0 | 0.0% |
| 3:15:00 to 3:17:30 | 0 | 0.0% |
| 3:17:30 to 3:20:00 | 2 | 0.1% |
This chart shows how many athletes finished in each 2.5-minute band, fastest on the left.A field of normal spread: typical 1:11:29, middle half about 1:05:01 to 1:19:38, fastest 10% (green) under 1:00:12.The marked line is fastest 25%: 1:05:00. The busiest band was 1:05:00 to 1:07:30.
See the numbers
| Time band | How many | Share |
|---|---|---|
| 50:00 to 52:30 | 5 | 0.2% |
| 52:30 to 55:00 | 27 | 1.1% |
| 55:00 to 57:30 | 48 | 1.9% |
| 57:30 to 1:00:00 | 150 | 6.1% |
| 1:00:00 to 1:02:30 | 178 | 7.2% |
| 1:02:30 to 1:05:00 | 207 | 8.4% |
| 1:05:00 to 1:07:30 | 247 | 10.0% |
| 1:07:30 to 1:10:00 | 225 | 9.1% |
| 1:10:00 to 1:12:30 | 232 | 9.4% |
| 1:12:30 to 1:15:00 | 195 | 7.9% |
| 1:15:00 to 1:17:30 | 195 | 7.9% |
| 1:17:30 to 1:20:00 | 165 | 6.7% |
| 1:20:00 to 1:22:30 | 120 | 4.9% |
| 1:22:30 to 1:25:00 | 100 | 4.1% |
| 1:25:00 to 1:27:30 | 101 | 4.1% |
| 1:27:30 to 1:30:00 | 82 | 3.3% |
| 1:30:00 to 1:32:30 | 39 | 1.6% |
| 1:32:30 to 1:35:00 | 37 | 1.5% |
| 1:35:00 to 1:37:30 | 28 | 1.1% |
| 1:37:30 to 1:40:00 | 26 | 1.1% |
| 1:40:00 to 1:42:30 | 15 | 0.6% |
| 1:42:30 to 1:45:00 | 11 | 0.4% |
| 1:45:00 to 1:47:30 | 15 | 0.6% |
| 1:47:30 to 1:50:00 | 4 | 0.2% |
| 1:50:00 to 1:52:30 | 3 | 0.1% |
| 1:52:30 to 1:55:00 | 3 | 0.1% |
| 1:55:00 to 1:57:30 | 4 | 0.2% |
| 1:57:30 to 2:00:00 | 1 | 0.0% |
| 2:00:00 to 2:02:30 | 1 | 0.0% |
| 2:02:30 to 2:05:00 | 0 | 0.0% |
| 2:05:00 to 2:07:30 | 0 | 0.0% |
| 2:07:30 to 2:10:00 | 0 | 0.0% |
| 2:10:00 to 2:12:30 | 1 | 0.0% |
| 2:12:30 to 2:15:00 | 0 | 0.0% |
| 2:15:00 to 2:17:30 | 0 | 0.0% |
| 2:17:30 to 2:20:00 | 0 | 0.0% |
| 2:20:00 to 2:22:30 | 0 | 0.0% |
| 2:22:30 to 2:25:00 | 0 | 0.0% |
| 2:25:00 to 2:27:30 | 1 | 0.0% |
This chart shows how many athletes finished in each 2.5-minute band, fastest on the left.A field of normal spread: typical 1:25:22, middle half about 1:18:23 to 1:34:01, fastest 10% (green) under 1:12:42.The marked line is fastest 25%: 1:18:26. The busiest band was 1:20:00 to 1:22:30.
See the numbers
| Time band | How many | Share |
|---|---|---|
| 57:30 to 1:00:00 | 1 | 0.0% |
| 1:00:00 to 1:02:30 | 9 | 0.4% |
| 1:02:30 to 1:05:00 | 13 | 0.5% |
| 1:05:00 to 1:07:30 | 43 | 1.8% |
| 1:07:30 to 1:10:00 | 68 | 2.8% |
| 1:10:00 to 1:12:30 | 98 | 4.0% |
| 1:12:30 to 1:15:00 | 150 | 6.2% |
| 1:15:00 to 1:17:30 | 161 | 6.6% |
| 1:17:30 to 1:20:00 | 181 | 7.5% |
| 1:20:00 to 1:22:30 | 238 | 9.8% |
| 1:22:30 to 1:25:00 | 226 | 9.3% |
| 1:25:00 to 1:27:30 | 209 | 8.6% |
| 1:27:30 to 1:30:00 | 198 | 8.2% |
| 1:30:00 to 1:32:30 | 148 | 6.1% |
| 1:32:30 to 1:35:00 | 127 | 5.2% |
| 1:35:00 to 1:37:30 | 113 | 4.7% |
| 1:37:30 to 1:40:00 | 100 | 4.1% |
| 1:40:00 to 1:42:30 | 62 | 2.6% |
| 1:42:30 to 1:45:00 | 72 | 3.0% |
| 1:45:00 to 1:47:30 | 45 | 1.9% |
| 1:47:30 to 1:50:00 | 42 | 1.7% |
| 1:50:00 to 1:52:30 | 19 | 0.8% |
| 1:52:30 to 1:55:00 | 19 | 0.8% |
| 1:55:00 to 1:57:30 | 21 | 0.9% |
| 1:57:30 to 2:00:00 | 14 | 0.6% |
| 2:00:00 to 2:02:30 | 9 | 0.4% |
| 2:02:30 to 2:05:00 | 10 | 0.4% |
| 2:05:00 to 2:07:30 | 10 | 0.4% |
| 2:07:30 to 2:10:00 | 6 | 0.2% |
| 2:10:00 to 2:12:30 | 3 | 0.1% |
| 2:12:30 to 2:15:00 | 2 | 0.1% |
| 2:15:00 to 2:17:30 | 2 | 0.1% |
| 2:17:30 to 2:20:00 | 1 | 0.0% |
| 2:20:00 to 2:22:30 | 2 | 0.1% |
| 2:22:30 to 2:25:00 | 1 | 0.0% |
| 2:25:00 to 2:27:30 | 1 | 0.0% |
| 2:27:30 to 2:30:00 | 1 | 0.0% |
| 2:30:00 to 2:32:30 | 1 | 0.0% |
| 2:32:30 to 2:35:00 | 1 | 0.0% |
This chart shows how many athletes finished in each 2.5-minute band, fastest on the left.A field of normal spread: typical 1:19:51, middle half about 1:12:12 to 1:28:56, fastest 10% (green) under 1:06:18.The marked line is fastest 25%: 1:12:07. The busiest band was 1:17:30 to 1:20:00.
See the numbers
| Time band | How many | Share |
|---|---|---|
| 52:30 to 55:00 | 2 | 0.1% |
| 55:00 to 57:30 | 17 | 0.8% |
| 57:30 to 1:00:00 | 34 | 1.6% |
| 1:00:00 to 1:02:30 | 49 | 2.3% |
| 1:02:30 to 1:05:00 | 61 | 2.8% |
| 1:05:00 to 1:07:30 | 100 | 4.6% |
| 1:07:30 to 1:10:00 | 138 | 6.4% |
| 1:10:00 to 1:12:30 | 157 | 7.3% |
| 1:12:30 to 1:15:00 | 166 | 7.7% |
| 1:15:00 to 1:17:30 | 180 | 8.3% |
| 1:17:30 to 1:20:00 | 187 | 8.7% |
| 1:20:00 to 1:22:30 | 168 | 7.8% |
| 1:22:30 to 1:25:00 | 155 | 7.2% |
| 1:25:00 to 1:27:30 | 133 | 6.2% |
| 1:27:30 to 1:30:00 | 124 | 5.7% |
| 1:30:00 to 1:32:30 | 97 | 4.5% |
| 1:32:30 to 1:35:00 | 86 | 4.0% |
| 1:35:00 to 1:37:30 | 63 | 2.9% |
| 1:37:30 to 1:40:00 | 43 | 2.0% |
| 1:40:00 to 1:42:30 | 42 | 1.9% |
| 1:42:30 to 1:45:00 | 33 | 1.5% |
| 1:45:00 to 1:47:30 | 27 | 1.3% |
| 1:47:30 to 1:50:00 | 25 | 1.2% |
| 1:50:00 to 1:52:30 | 16 | 0.7% |
| 1:52:30 to 1:55:00 | 18 | 0.8% |
| 1:55:00 to 1:57:30 | 7 | 0.3% |
| 1:57:30 to 2:00:00 | 6 | 0.3% |
| 2:00:00 to 2:02:30 | 4 | 0.2% |
| 2:02:30 to 2:05:00 | 4 | 0.2% |
| 2:05:00 to 2:07:30 | 7 | 0.3% |
| 2:07:30 to 2:10:00 | 2 | 0.1% |
| 2:10:00 to 2:12:30 | 1 | 0.0% |
| 2:12:30 to 2:15:00 | 2 | 0.1% |
| 2:15:00 to 2:17:30 | 0 | 0.0% |
| 2:17:30 to 2:20:00 | 1 | 0.0% |
| 2:20:00 to 2:22:30 | 0 | 0.0% |
| 2:22:30 to 2:25:00 | 0 | 0.0% |
| 2:25:00 to 2:27:30 | 0 | 0.0% |
| 2:27:30 to 2:30:00 | 1 | 0.0% |
| 2:30:00 to 2:32:30 | 0 | 0.0% |
| 2:32:30 to 2:35:00 | 0 | 0.0% |
| 2:35:00 to 2:37:30 | 0 | 0.0% |
| 2:37:30 to 2:40:00 | 0 | 0.0% |
| 2:40:00 to 2:42:30 | 0 | 0.0% |
| 2:42:30 to 2:45:00 | 0 | 0.0% |
| 2:45:00 to 2:47:30 | 0 | 0.0% |
| 2:47:30 to 2:50:00 | 1 | 0.0% |
| 2:50:00 to 2:52:30 | 0 | 0.0% |
| 2:52:30 to 2:55:00 | 0 | 0.0% |
| 2:55:00 to 2:57:30 | 0 | 0.0% |
| 2:57:30 to 3:00:00 | 0 | 0.0% |
| 3:00:00 to 3:02:30 | 1 | 0.0% |
This chart shows how many athletes finished in each 2.5-minute band, fastest on the left.A field of normal spread: typical 1:14:19, middle half about 1:07:32 to 1:22:44, fastest 10% (green) under 1:03:03.The marked line is fastest 25%: 1:07:35. The busiest band was 1:12:30 to 1:15:00.
See the numbers
| Time band | How many | Share |
|---|---|---|
| 55:00 to 57:30 | 5 | 1.2% |
| 57:30 to 1:00:00 | 11 | 2.5% |
| 1:00:00 to 1:02:30 | 18 | 4.1% |
| 1:02:30 to 1:05:00 | 35 | 8.1% |
| 1:05:00 to 1:07:30 | 39 | 9.0% |
| 1:07:30 to 1:10:00 | 37 | 8.5% |
| 1:10:00 to 1:12:30 | 39 | 9.0% |
| 1:12:30 to 1:15:00 | 42 | 9.7% |
| 1:15:00 to 1:17:30 | 34 | 7.8% |
| 1:17:30 to 1:20:00 | 29 | 6.7% |
| 1:20:00 to 1:22:30 | 34 | 7.8% |
| 1:22:30 to 1:25:00 | 27 | 6.2% |
| 1:25:00 to 1:27:30 | 14 | 3.2% |
| 1:27:30 to 1:30:00 | 13 | 3.0% |
| 1:30:00 to 1:32:30 | 18 | 4.1% |
| 1:32:30 to 1:35:00 | 6 | 1.4% |
| 1:35:00 to 1:37:30 | 5 | 1.2% |
| 1:37:30 to 1:40:00 | 5 | 1.2% |
| 1:40:00 to 1:42:30 | 3 | 0.7% |
| 1:42:30 to 1:45:00 | 4 | 0.9% |
| 1:45:00 to 1:47:30 | 7 | 1.6% |
| 1:47:30 to 1:50:00 | 0 | 0.0% |
| 1:50:00 to 1:52:30 | 0 | 0.0% |
| 1:52:30 to 1:55:00 | 3 | 0.7% |
| 1:55:00 to 1:57:30 | 1 | 0.2% |
| 1:57:30 to 2:00:00 | 1 | 0.2% |
| 2:00:00 to 2:02:30 | 1 | 0.2% |
| 2:02:30 to 2:05:00 | 0 | 0.0% |
| 2:05:00 to 2:07:30 | 3 | 0.7% |
This chart shows how many athletes finished in each 2.5-minute band, fastest on the left.A field of normal spread with a long slow tail: typical 1:27:03, middle half about 1:18:35 to 1:37:25, fastest 10% (green) under 1:10:37.The marked line is fastest 25%: 1:19:06. The busiest band was 1:20:00 to 1:22:30.
See the numbers
| Time band | How many | Share |
|---|---|---|
| 1:00:00 to 1:02:30 | 3 | 0.9% |
| 1:02:30 to 1:05:00 | 6 | 1.8% |
| 1:05:00 to 1:07:30 | 4 | 1.2% |
| 1:07:30 to 1:10:00 | 19 | 5.8% |
| 1:10:00 to 1:12:30 | 13 | 4.0% |
| 1:12:30 to 1:15:00 | 13 | 4.0% |
| 1:15:00 to 1:17:30 | 17 | 5.2% |
| 1:17:30 to 1:20:00 | 15 | 4.6% |
| 1:20:00 to 1:22:30 | 32 | 9.8% |
| 1:22:30 to 1:25:00 | 24 | 7.4% |
| 1:25:00 to 1:27:30 | 19 | 5.8% |
| 1:27:30 to 1:30:00 | 23 | 7.1% |
| 1:30:00 to 1:32:30 | 23 | 7.1% |
| 1:32:30 to 1:35:00 | 18 | 5.5% |
| 1:35:00 to 1:37:30 | 16 | 4.9% |
| 1:37:30 to 1:40:00 | 10 | 3.1% |
| 1:40:00 to 1:42:30 | 11 | 3.4% |
| 1:42:30 to 1:45:00 | 9 | 2.8% |
| 1:45:00 to 1:47:30 | 3 | 0.9% |
| 1:47:30 to 1:50:00 | 6 | 1.8% |
| 1:50:00 to 1:52:30 | 7 | 2.1% |
| 1:52:30 to 1:55:00 | 7 | 2.1% |
| 1:55:00 to 1:57:30 | 5 | 1.5% |
| 1:57:30 to 2:00:00 | 6 | 1.8% |
| 2:00:00 to 2:02:30 | 2 | 0.6% |
| 2:02:30 to 2:05:00 | 2 | 0.6% |
| 2:05:00 to 2:07:30 | 2 | 0.6% |
| 2:07:30 to 2:10:00 | 1 | 0.3% |
| 2:10:00 to 2:12:30 | 1 | 0.3% |
| 2:12:30 to 2:15:00 | 1 | 0.3% |
| 2:15:00 to 2:17:30 | 2 | 0.6% |
| 2:17:30 to 2:20:00 | 0 | 0.0% |
| 2:20:00 to 2:22:30 | 0 | 0.0% |
| 2:22:30 to 2:25:00 | 0 | 0.0% |
| 2:25:00 to 2:27:30 | 3 | 0.9% |
| 2:27:30 to 2:30:00 | 1 | 0.3% |
| 2:30:00 to 2:32:30 | 0 | 0.0% |
| 2:32:30 to 2:35:00 | 0 | 0.0% |
| 2:35:00 to 2:37:30 | 1 | 0.3% |
| 2:37:30 to 2:40:00 | 0 | 0.0% |
| 2:40:00 to 2:42:30 | 0 | 0.0% |
| 2:42:30 to 2:45:00 | 0 | 0.0% |
| 2:45:00 to 2:47:30 | 0 | 0.0% |
| 2:47:30 to 2:50:00 | 0 | 0.0% |
| 2:50:00 to 2:52:30 | 0 | 0.0% |
| 2:52:30 to 2:55:00 | 0 | 0.0% |
| 2:55:00 to 2:57:30 | 0 | 0.0% |
| 2:57:30 to 3:00:00 | 0 | 0.0% |
| 3:00:00 to 3:02:30 | 0 | 0.0% |
| 3:02:30 to 3:05:00 | 0 | 0.0% |
| 3:05:00 to 3:07:30 | 1 | 0.3% |
Course notes
- Running was 48% of the typical finish: normal. Your splits compare cleanly with other races.
- The fastest 25% gained most on the runs; of the stations, wall balls.
Before you go
Raced Birmingham? Train for your next race and beat this time.
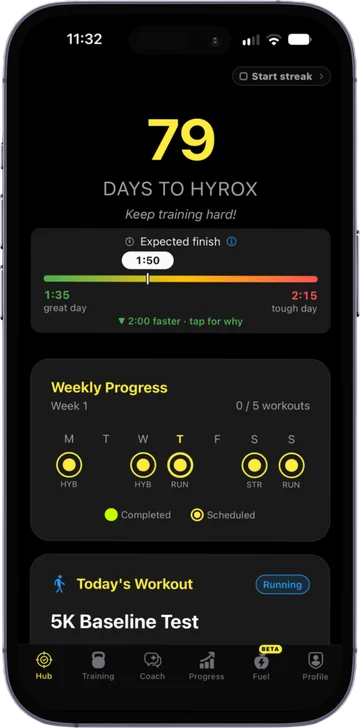
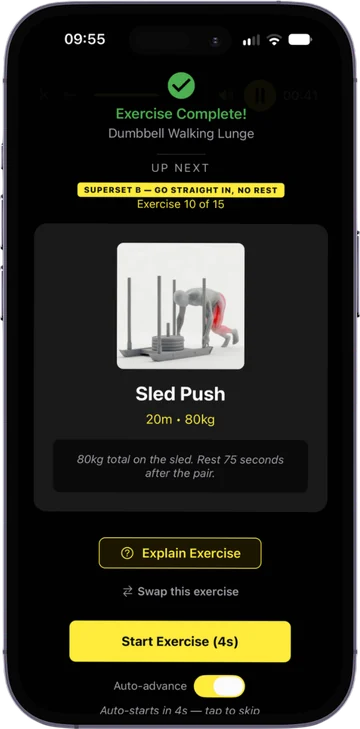
The RoxHype app is your training plan to race day: built from your splits, your kit and your race date, and adjusted every week.
- A week-by-week plan that counts down to your race
- Extra work on your slowest stations
- Adjusts every week to what you actually did
Free to download. Used by more than 40,000 HYROX athletes.