
HYROX Barcelona 2026
Leapmotor HYROX Barcelona
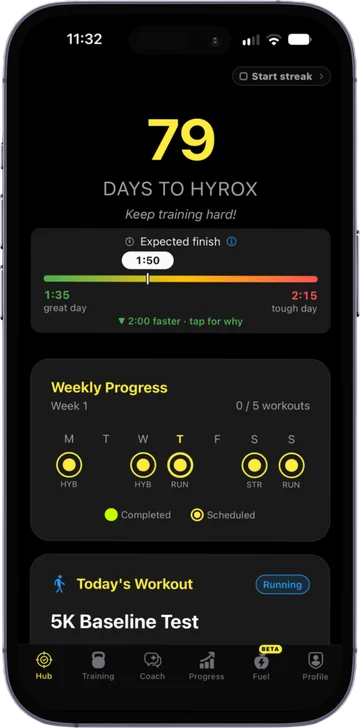
Free on RoxHype: your readiness score for Barcelona and week 1. The full plan to race day is in the app.
Finish times appear here within hours of each race day's first finishers, and this page checks for them by itself. Every split follows with the next daily update.
What time do I need?
This chart shows how many athletes finished in each 2.5-minute band, fastest on the left.A field of normal spread: typical 1:22:58, middle half about 1:14:44 to 1:32:48, fastest 10% (green) under 1:08:46.The marked line is fastest 25%: 1:14:46. The busiest band was 1:17:30 to 1:20:00.
See the numbers
| Time band | How many | Share |
|---|---|---|
| 52:30 to 55:00 | 1 | 0.0% |
| 55:00 to 57:30 | 3 | 0.1% |
| 57:30 to 1:00:00 | 15 | 0.6% |
| 1:00:00 to 1:02:30 | 33 | 1.4% |
| 1:02:30 to 1:05:00 | 57 | 2.4% |
| 1:05:00 to 1:07:30 | 77 | 3.3% |
| 1:07:30 to 1:10:00 | 117 | 5.0% |
| 1:10:00 to 1:12:30 | 137 | 5.8% |
| 1:12:30 to 1:15:00 | 165 | 7.0% |
| 1:15:00 to 1:17:30 | 163 | 6.9% |
| 1:17:30 to 1:20:00 | 208 | 8.9% |
| 1:20:00 to 1:22:30 | 176 | 7.5% |
| 1:22:30 to 1:25:00 | 159 | 6.8% |
| 1:25:00 to 1:27:30 | 176 | 7.5% |
| 1:27:30 to 1:30:00 | 148 | 6.3% |
| 1:30:00 to 1:32:30 | 115 | 4.9% |
| 1:32:30 to 1:35:00 | 102 | 4.3% |
| 1:35:00 to 1:37:30 | 87 | 3.7% |
| 1:37:30 to 1:40:00 | 76 | 3.2% |
| 1:40:00 to 1:42:30 | 69 | 2.9% |
| 1:42:30 to 1:45:00 | 38 | 1.6% |
| 1:45:00 to 1:47:30 | 39 | 1.7% |
| 1:47:30 to 1:50:00 | 40 | 1.7% |
| 1:50:00 to 1:52:30 | 38 | 1.6% |
| 1:52:30 to 1:55:00 | 15 | 0.6% |
| 1:55:00 to 1:57:30 | 19 | 0.8% |
| 1:57:30 to 2:00:00 | 13 | 0.6% |
| 2:00:00 to 2:02:30 | 11 | 0.5% |
| 2:02:30 to 2:05:00 | 10 | 0.4% |
| 2:05:00 to 2:07:30 | 10 | 0.4% |
| 2:07:30 to 2:10:00 | 8 | 0.3% |
| 2:10:00 to 2:12:30 | 4 | 0.2% |
| 2:12:30 to 2:15:00 | 5 | 0.2% |
| 2:15:00 to 2:17:30 | 4 | 0.2% |
| 2:17:30 to 2:20:00 | 1 | 0.0% |
| 2:20:00 to 2:22:30 | 0 | 0.0% |
| 2:22:30 to 2:25:00 | 2 | 0.1% |
| 2:25:00 to 2:27:30 | 0 | 0.0% |
| 2:27:30 to 2:30:00 | 3 | 0.1% |
| 2:30:00 to 2:32:30 | 0 | 0.0% |
| 2:32:30 to 2:35:00 | 1 | 0.0% |
| 2:35:00 to 2:37:30 | 1 | 0.0% |
| 2:37:30 to 2:40:00 | 1 | 0.0% |
| 2:40:00 to 2:42:30 | 0 | 0.0% |
| 2:42:30 to 2:45:00 | 0 | 0.0% |
| 2:45:00 to 2:47:30 | 0 | 0.0% |
| 2:47:30 to 2:50:00 | 0 | 0.0% |
| 2:50:00 to 2:52:30 | 1 | 0.0% |
| 2:52:30 to 2:55:00 | 1 | 0.0% |
| 2:55:00 to 2:57:30 | 0 | 0.0% |
| 2:57:30 to 3:00:00 | 0 | 0.0% |
| 3:00:00 to 3:02:30 | 0 | 0.0% |
| 3:02:30 to 3:05:00 | 0 | 0.0% |
| 3:05:00 to 3:07:30 | 0 | 0.0% |
| 3:07:30 to 3:10:00 | 1 | 0.0% |
This chart shows how many athletes finished in each 2.5-minute band, fastest on the left.A field of normal spread with a long slow tail: typical 1:33:47, middle half about 1:24:21 to 1:45:03, fastest 10% (green) under 1:17:29.The marked line is fastest 25%: 1:24:29. The busiest band was 1:32:30 to 1:35:00.
See the numbers
| Time band | How many | Share |
|---|---|---|
| 1:02:30 to 1:05:00 | 1 | 0.1% |
| 1:05:00 to 1:07:30 | 7 | 0.5% |
| 1:07:30 to 1:10:00 | 12 | 0.9% |
| 1:10:00 to 1:12:30 | 35 | 2.7% |
| 1:12:30 to 1:15:00 | 34 | 2.6% |
| 1:15:00 to 1:17:30 | 41 | 3.2% |
| 1:17:30 to 1:20:00 | 71 | 5.5% |
| 1:20:00 to 1:22:30 | 66 | 5.1% |
| 1:22:30 to 1:25:00 | 77 | 5.9% |
| 1:25:00 to 1:27:30 | 83 | 6.4% |
| 1:27:30 to 1:30:00 | 79 | 6.1% |
| 1:30:00 to 1:32:30 | 92 | 7.1% |
| 1:32:30 to 1:35:00 | 96 | 7.4% |
| 1:35:00 to 1:37:30 | 88 | 6.8% |
| 1:37:30 to 1:40:00 | 70 | 5.4% |
| 1:40:00 to 1:42:30 | 67 | 5.2% |
| 1:42:30 to 1:45:00 | 52 | 4.0% |
| 1:45:00 to 1:47:30 | 45 | 3.5% |
| 1:47:30 to 1:50:00 | 40 | 3.1% |
| 1:50:00 to 1:52:30 | 39 | 3.0% |
| 1:52:30 to 1:55:00 | 25 | 1.9% |
| 1:55:00 to 1:57:30 | 19 | 1.5% |
| 1:57:30 to 2:00:00 | 20 | 1.5% |
| 2:00:00 to 2:02:30 | 26 | 2.0% |
| 2:02:30 to 2:05:00 | 15 | 1.2% |
| 2:05:00 to 2:07:30 | 15 | 1.2% |
| 2:07:30 to 2:10:00 | 15 | 1.2% |
| 2:10:00 to 2:12:30 | 9 | 0.7% |
| 2:12:30 to 2:15:00 | 8 | 0.6% |
| 2:15:00 to 2:17:30 | 10 | 0.8% |
| 2:17:30 to 2:20:00 | 6 | 0.5% |
| 2:20:00 to 2:22:30 | 3 | 0.2% |
| 2:22:30 to 2:25:00 | 2 | 0.2% |
| 2:25:00 to 2:27:30 | 5 | 0.4% |
| 2:27:30 to 2:30:00 | 1 | 0.1% |
| 2:30:00 to 2:32:30 | 3 | 0.2% |
| 2:32:30 to 2:35:00 | 6 | 0.5% |
| 2:35:00 to 2:37:30 | 5 | 0.4% |
| 2:37:30 to 2:40:00 | 0 | 0.0% |
| 2:40:00 to 2:42:30 | 1 | 0.1% |
| 2:42:30 to 2:45:00 | 0 | 0.0% |
| 2:45:00 to 2:47:30 | 1 | 0.1% |
| 2:47:30 to 2:50:00 | 0 | 0.0% |
| 2:50:00 to 2:52:30 | 1 | 0.1% |
| 2:52:30 to 2:55:00 | 1 | 0.1% |
| 2:55:00 to 2:57:30 | 2 | 0.2% |
| 2:57:30 to 3:00:00 | 0 | 0.0% |
| 3:00:00 to 3:02:30 | 1 | 0.1% |
| 3:02:30 to 3:05:00 | 0 | 0.0% |
| 3:05:00 to 3:07:30 | 0 | 0.0% |
| 3:07:30 to 3:10:00 | 0 | 0.0% |
| 3:10:00 to 3:12:30 | 0 | 0.0% |
| 3:12:30 to 3:15:00 | 0 | 0.0% |
| 3:15:00 to 3:17:30 | 0 | 0.0% |
| 3:17:30 to 3:20:00 | 1 | 0.1% |
This chart shows how many athletes finished in each 2.5-minute band, fastest on the left.A field of normal spread: typical 1:13:01, middle half about 1:07:20 to 1:20:44, fastest 10% (green) under 1:02:45.The marked line is fastest 25%: 1:07:19. The busiest band was 1:10:00 to 1:12:30.
See the numbers
| Time band | How many | Share |
|---|---|---|
| 50:00 to 52:30 | 3 | 0.2% |
| 52:30 to 55:00 | 2 | 0.1% |
| 55:00 to 57:30 | 22 | 1.3% |
| 57:30 to 1:00:00 | 47 | 2.7% |
| 1:00:00 to 1:02:30 | 89 | 5.2% |
| 1:02:30 to 1:05:00 | 110 | 6.4% |
| 1:05:00 to 1:07:30 | 169 | 9.8% |
| 1:07:30 to 1:10:00 | 181 | 10.5% |
| 1:10:00 to 1:12:30 | 201 | 11.7% |
| 1:12:30 to 1:15:00 | 150 | 8.7% |
| 1:15:00 to 1:17:30 | 155 | 9.0% |
| 1:17:30 to 1:20:00 | 122 | 7.1% |
| 1:20:00 to 1:22:30 | 138 | 8.0% |
| 1:22:30 to 1:25:00 | 89 | 5.2% |
| 1:25:00 to 1:27:30 | 39 | 2.3% |
| 1:27:30 to 1:30:00 | 55 | 3.2% |
| 1:30:00 to 1:32:30 | 26 | 1.5% |
| 1:32:30 to 1:35:00 | 25 | 1.5% |
| 1:35:00 to 1:37:30 | 22 | 1.3% |
| 1:37:30 to 1:40:00 | 19 | 1.1% |
| 1:40:00 to 1:42:30 | 13 | 0.8% |
| 1:42:30 to 1:45:00 | 3 | 0.2% |
| 1:45:00 to 1:47:30 | 10 | 0.6% |
| 1:47:30 to 1:50:00 | 7 | 0.4% |
| 1:50:00 to 1:52:30 | 7 | 0.4% |
| 1:52:30 to 1:55:00 | 4 | 0.2% |
| 1:55:00 to 1:57:30 | 3 | 0.2% |
| 1:57:30 to 2:00:00 | 2 | 0.1% |
| 2:00:00 to 2:02:30 | 2 | 0.1% |
| 2:02:30 to 2:05:00 | 1 | 0.1% |
| 2:05:00 to 2:07:30 | 4 | 0.2% |
| 2:07:30 to 2:10:00 | 1 | 0.1% |
| 2:10:00 to 2:12:30 | 0 | 0.0% |
| 2:12:30 to 2:15:00 | 0 | 0.0% |
| 2:15:00 to 2:17:30 | 0 | 0.0% |
| 2:17:30 to 2:20:00 | 0 | 0.0% |
| 2:20:00 to 2:22:30 | 0 | 0.0% |
| 2:22:30 to 2:25:00 | 0 | 0.0% |
| 2:25:00 to 2:27:30 | 0 | 0.0% |
| 2:27:30 to 2:30:00 | 1 | 0.1% |
This chart shows how many athletes finished in each 2.5-minute band, fastest on the left.A field of normal spread: typical 1:25:29, middle half about 1:18:33 to 1:33:20, fastest 10% (green) under 1:13:16.The marked line is fastest 25%: 1:18:35. The busiest band was 1:22:30 to 1:25:00.
See the numbers
| Time band | How many | Share |
|---|---|---|
| 1:00:00 to 1:02:30 | 1 | 0.1% |
| 1:02:30 to 1:05:00 | 8 | 0.4% |
| 1:05:00 to 1:07:30 | 18 | 1.0% |
| 1:07:30 to 1:10:00 | 45 | 2.4% |
| 1:10:00 to 1:12:30 | 82 | 4.4% |
| 1:12:30 to 1:15:00 | 111 | 6.0% |
| 1:15:00 to 1:17:30 | 134 | 7.2% |
| 1:17:30 to 1:20:00 | 152 | 8.2% |
| 1:20:00 to 1:22:30 | 170 | 9.2% |
| 1:22:30 to 1:25:00 | 171 | 9.2% |
| 1:25:00 to 1:27:30 | 166 | 9.0% |
| 1:27:30 to 1:30:00 | 165 | 8.9% |
| 1:30:00 to 1:32:30 | 133 | 7.2% |
| 1:32:30 to 1:35:00 | 96 | 5.2% |
| 1:35:00 to 1:37:30 | 99 | 5.3% |
| 1:37:30 to 1:40:00 | 64 | 3.5% |
| 1:40:00 to 1:42:30 | 44 | 2.4% |
| 1:42:30 to 1:45:00 | 49 | 2.6% |
| 1:45:00 to 1:47:30 | 33 | 1.8% |
| 1:47:30 to 1:50:00 | 24 | 1.3% |
| 1:50:00 to 1:52:30 | 18 | 1.0% |
| 1:52:30 to 1:55:00 | 16 | 0.9% |
| 1:55:00 to 1:57:30 | 15 | 0.8% |
| 1:57:30 to 2:00:00 | 8 | 0.4% |
| 2:00:00 to 2:02:30 | 5 | 0.3% |
| 2:02:30 to 2:05:00 | 9 | 0.5% |
| 2:05:00 to 2:07:30 | 2 | 0.1% |
| 2:07:30 to 2:10:00 | 2 | 0.1% |
| 2:10:00 to 2:12:30 | 3 | 0.2% |
| 2:12:30 to 2:15:00 | 0 | 0.0% |
| 2:15:00 to 2:17:30 | 1 | 0.1% |
| 2:17:30 to 2:20:00 | 2 | 0.1% |
| 2:20:00 to 2:22:30 | 0 | 0.0% |
| 2:22:30 to 2:25:00 | 1 | 0.1% |
| 2:25:00 to 2:27:30 | 2 | 0.1% |
| 2:27:30 to 2:30:00 | 0 | 0.0% |
| 2:30:00 to 2:32:30 | 1 | 0.1% |
| 2:32:30 to 2:35:00 | 0 | 0.0% |
| 2:35:00 to 2:37:30 | 0 | 0.0% |
| 2:37:30 to 2:40:00 | 0 | 0.0% |
| 2:40:00 to 2:42:30 | 0 | 0.0% |
| 2:42:30 to 2:45:00 | 0 | 0.0% |
| 2:45:00 to 2:47:30 | 0 | 0.0% |
| 2:47:30 to 2:50:00 | 0 | 0.0% |
| 2:50:00 to 2:52:30 | 1 | 0.1% |
This chart shows how many athletes finished in each 2.5-minute band, fastest on the left.A field of normal spread: typical 1:19:59, middle half about 1:13:17 to 1:27:28, fastest 10% (green) under 1:07:59.The marked line is fastest 25%: 1:13:18. The busiest band was 1:15:00 to 1:17:30.
See the numbers
| Time band | How many | Share |
|---|---|---|
| 52:30 to 55:00 | 5 | 0.2% |
| 55:00 to 57:30 | 7 | 0.3% |
| 57:30 to 1:00:00 | 7 | 0.3% |
| 1:00:00 to 1:02:30 | 31 | 1.5% |
| 1:02:30 to 1:05:00 | 55 | 2.7% |
| 1:05:00 to 1:07:30 | 82 | 4.0% |
| 1:07:30 to 1:10:00 | 139 | 6.8% |
| 1:10:00 to 1:12:30 | 140 | 6.8% |
| 1:12:30 to 1:15:00 | 153 | 7.4% |
| 1:15:00 to 1:17:30 | 221 | 10.7% |
| 1:17:30 to 1:20:00 | 192 | 9.3% |
| 1:20:00 to 1:22:30 | 185 | 9.0% |
| 1:22:30 to 1:25:00 | 170 | 8.3% |
| 1:25:00 to 1:27:30 | 158 | 7.7% |
| 1:27:30 to 1:30:00 | 125 | 6.1% |
| 1:30:00 to 1:32:30 | 61 | 3.0% |
| 1:32:30 to 1:35:00 | 83 | 4.0% |
| 1:35:00 to 1:37:30 | 51 | 2.5% |
| 1:37:30 to 1:40:00 | 45 | 2.2% |
| 1:40:00 to 1:42:30 | 35 | 1.7% |
| 1:42:30 to 1:45:00 | 28 | 1.4% |
| 1:45:00 to 1:47:30 | 13 | 0.6% |
| 1:47:30 to 1:50:00 | 15 | 0.7% |
| 1:50:00 to 1:52:30 | 15 | 0.7% |
| 1:52:30 to 1:55:00 | 9 | 0.4% |
| 1:55:00 to 1:57:30 | 10 | 0.5% |
| 1:57:30 to 2:00:00 | 8 | 0.4% |
| 2:00:00 to 2:02:30 | 4 | 0.2% |
| 2:02:30 to 2:05:00 | 3 | 0.1% |
| 2:05:00 to 2:07:30 | 1 | 0.0% |
| 2:07:30 to 2:10:00 | 0 | 0.0% |
| 2:10:00 to 2:12:30 | 1 | 0.0% |
| 2:12:30 to 2:15:00 | 4 | 0.2% |
| 2:15:00 to 2:17:30 | 0 | 0.0% |
| 2:17:30 to 2:20:00 | 0 | 0.0% |
| 2:20:00 to 2:22:30 | 0 | 0.0% |
| 2:22:30 to 2:25:00 | 0 | 0.0% |
| 2:25:00 to 2:27:30 | 0 | 0.0% |
| 2:27:30 to 2:30:00 | 1 | 0.0% |
This chart shows how many athletes finished in each 2.5-minute band, fastest on the left.A field of normal spread with a long slow tail: typical 1:16:20, middle half about 1:10:12 to 1:25:47, fastest 10% (green) under 1:05:15.The marked line is fastest 25%: 1:10:17. The busiest band was 1:12:30 to 1:15:00.
See the numbers
| Time band | How many | Share |
|---|---|---|
| 52:30 to 55:00 | 1 | 0.2% |
| 55:00 to 57:30 | 6 | 1.0% |
| 57:30 to 1:00:00 | 11 | 1.8% |
| 1:00:00 to 1:02:30 | 18 | 2.9% |
| 1:02:30 to 1:05:00 | 22 | 3.6% |
| 1:05:00 to 1:07:30 | 46 | 7.4% |
| 1:07:30 to 1:10:00 | 46 | 7.4% |
| 1:10:00 to 1:12:30 | 57 | 9.2% |
| 1:12:30 to 1:15:00 | 65 | 10.5% |
| 1:15:00 to 1:17:30 | 55 | 8.9% |
| 1:17:30 to 1:20:00 | 52 | 8.4% |
| 1:20:00 to 1:22:30 | 45 | 7.3% |
| 1:22:30 to 1:25:00 | 31 | 5.0% |
| 1:25:00 to 1:27:30 | 27 | 4.4% |
| 1:27:30 to 1:30:00 | 18 | 2.9% |
| 1:30:00 to 1:32:30 | 23 | 3.7% |
| 1:32:30 to 1:35:00 | 21 | 3.4% |
| 1:35:00 to 1:37:30 | 10 | 1.6% |
| 1:37:30 to 1:40:00 | 15 | 2.4% |
| 1:40:00 to 1:42:30 | 9 | 1.5% |
| 1:42:30 to 1:45:00 | 8 | 1.3% |
| 1:45:00 to 1:47:30 | 6 | 1.0% |
| 1:47:30 to 1:50:00 | 7 | 1.1% |
| 1:50:00 to 1:52:30 | 2 | 0.3% |
| 1:52:30 to 1:55:00 | 3 | 0.5% |
| 1:55:00 to 1:57:30 | 2 | 0.3% |
| 1:57:30 to 2:00:00 | 3 | 0.5% |
| 2:00:00 to 2:02:30 | 1 | 0.2% |
| 2:02:30 to 2:05:00 | 1 | 0.2% |
| 2:05:00 to 2:07:30 | 3 | 0.5% |
| 2:07:30 to 2:10:00 | 2 | 0.3% |
| 2:10:00 to 2:12:30 | 0 | 0.0% |
| 2:12:30 to 2:15:00 | 0 | 0.0% |
| 2:15:00 to 2:17:30 | 1 | 0.2% |
| 2:17:30 to 2:20:00 | 0 | 0.0% |
| 2:20:00 to 2:22:30 | 0 | 0.0% |
| 2:22:30 to 2:25:00 | 0 | 0.0% |
| 2:25:00 to 2:27:30 | 0 | 0.0% |
| 2:27:30 to 2:30:00 | 0 | 0.0% |
| 2:30:00 to 2:32:30 | 1 | 0.2% |
This chart shows how many athletes finished in each 2.5-minute band, fastest on the left.A field of normal spread with a long slow tail: typical 1:25:07, middle half about 1:15:14 to 1:34:33, fastest 10% (green) under 1:10:56.The marked line is fastest 25%: 1:15:06. The busiest band was 1:25:00 to 1:27:30.
See the numbers
| Time band | How many | Share |
|---|---|---|
| 55:00 to 57:30 | 1 | 0.6% |
| 57:30 to 1:00:00 | 0 | 0.0% |
| 1:00:00 to 1:02:30 | 3 | 1.7% |
| 1:02:30 to 1:05:00 | 1 | 0.6% |
| 1:05:00 to 1:07:30 | 5 | 2.9% |
| 1:07:30 to 1:10:00 | 4 | 2.3% |
| 1:10:00 to 1:12:30 | 14 | 8.1% |
| 1:12:30 to 1:15:00 | 14 | 8.1% |
| 1:15:00 to 1:17:30 | 13 | 7.5% |
| 1:17:30 to 1:20:00 | 10 | 5.8% |
| 1:20:00 to 1:22:30 | 8 | 4.6% |
| 1:22:30 to 1:25:00 | 13 | 7.5% |
| 1:25:00 to 1:27:30 | 18 | 10.4% |
| 1:27:30 to 1:30:00 | 10 | 5.8% |
| 1:30:00 to 1:32:30 | 10 | 5.8% |
| 1:32:30 to 1:35:00 | 7 | 4.0% |
| 1:35:00 to 1:37:30 | 5 | 2.9% |
| 1:37:30 to 1:40:00 | 3 | 1.7% |
| 1:40:00 to 1:42:30 | 7 | 4.0% |
| 1:42:30 to 1:45:00 | 1 | 0.6% |
| 1:45:00 to 1:47:30 | 2 | 1.2% |
| 1:47:30 to 1:50:00 | 2 | 1.2% |
| 1:50:00 to 1:52:30 | 6 | 3.5% |
| 1:52:30 to 1:55:00 | 2 | 1.2% |
| 1:55:00 to 1:57:30 | 4 | 2.3% |
| 1:57:30 to 2:00:00 | 0 | 0.0% |
| 2:00:00 to 2:02:30 | 2 | 1.2% |
| 2:02:30 to 2:05:00 | 1 | 0.6% |
| 2:05:00 to 2:07:30 | 2 | 1.2% |
| 2:07:30 to 2:10:00 | 0 | 0.0% |
| 2:10:00 to 2:12:30 | 0 | 0.0% |
| 2:12:30 to 2:15:00 | 0 | 0.0% |
| 2:15:00 to 2:17:30 | 0 | 0.0% |
| 2:17:30 to 2:20:00 | 1 | 0.6% |
| 2:20:00 to 2:22:30 | 1 | 0.6% |
| 2:22:30 to 2:25:00 | 1 | 0.6% |
| 2:25:00 to 2:27:30 | 1 | 0.6% |
| 2:27:30 to 2:30:00 | 1 | 0.6% |
Course notes
- Running was 48% of the typical finish: normal. Your splits compare cleanly with other races.
- The fastest 25% gained most on the runs; of the stations, wall balls.
- Sled push ran 0:18 slower here than at a typical venue; wall balls 0:33 quicker.
Before you go
9 days to Barcelona. Get your training plan to race day.
The RoxHype app is your training plan to race day: built from your splits, your kit and your race date, and adjusted every week.
- A week-by-week plan that counts down to your race
- Extra work on your slowest stations
- Adjusts every week to what you actually did
Free to download. Used by more than 40,000 HYROX athletes.