
HYROX Abu Dhabi 2026 results
224 finishes so far. Find your name for your race report.
Find your result
| Race day | # | Athlete | Age group | Time |
|---|
Provisional lists, by race day. Tap your name for your full race report. Places are provisional and will still move: more start groups still to race over the next day.
Pick your race day
Finish times, Open · Friday
This chart shows how many athletes finished in each 2.5-minute band, fastest on the left.A widely spread field with a long slow tail: typical 1:43:26, middle half about 1:29:48 to 2:03:17, fastest 10% (green) under 1:24:14.
See the numbers
| Time band | How many | Share |
|---|---|---|
| 1:15:00 to 1:17:30 | 1 | 1.6% |
| 1:17:30 to 1:20:00 | 1 | 1.6% |
| 1:20:00 to 1:22:30 | 3 | 4.8% |
| 1:22:30 to 1:25:00 | 3 | 4.8% |
| 1:25:00 to 1:27:30 | 5 | 7.9% |
| 1:27:30 to 1:30:00 | 3 | 4.8% |
| 1:30:00 to 1:32:30 | 2 | 3.2% |
| 1:32:30 to 1:35:00 | 6 | 9.5% |
| 1:35:00 to 1:37:30 | 4 | 6.3% |
| 1:37:30 to 1:40:00 | 1 | 1.6% |
| 1:40:00 to 1:42:30 | 2 | 3.2% |
| 1:42:30 to 1:45:00 | 2 | 3.2% |
| 1:45:00 to 1:47:30 | 5 | 7.9% |
| 1:47:30 to 1:50:00 | 3 | 4.8% |
| 1:50:00 to 1:52:30 | 2 | 3.2% |
| 1:52:30 to 1:55:00 | 0 | 0.0% |
| 1:55:00 to 1:57:30 | 1 | 1.6% |
| 1:57:30 to 2:00:00 | 0 | 0.0% |
| 2:00:00 to 2:02:30 | 2 | 3.2% |
| 2:02:30 to 2:05:00 | 4 | 6.3% |
| 2:05:00 to 2:07:30 | 2 | 3.2% |
| 2:07:30 to 2:10:00 | 1 | 1.6% |
| 2:10:00 to 2:12:30 | 1 | 1.6% |
| 2:12:30 to 2:15:00 | 1 | 1.6% |
| 2:15:00 to 2:17:30 | 1 | 1.6% |
| 2:17:30 to 2:20:00 | 2 | 3.2% |
| 2:20:00 to 2:22:30 | 1 | 1.6% |
| 2:22:30 to 2:25:00 | 0 | 0.0% |
| 2:25:00 to 2:27:30 | 0 | 0.0% |
| 2:27:30 to 2:30:00 | 2 | 3.2% |
| 2:30:00 to 2:32:30 | 0 | 0.0% |
| 2:32:30 to 2:35:00 | 1 | 1.6% |
| 2:35:00 to 2:37:30 | 0 | 0.0% |
| 2:37:30 to 2:40:00 | 0 | 0.0% |
| 2:40:00 to 2:42:30 | 0 | 0.0% |
| 2:42:30 to 2:45:00 | 0 | 0.0% |
| 2:45:00 to 2:47:30 | 0 | 0.0% |
| 2:47:30 to 2:50:00 | 1 | 1.6% |
How to read
Each bar is how many finished in that time slot, fastest on the left, men and women together. Green is the fastest 10%; the line is the typical finish.
| # | Athlete | Age group | Time | |
|---|---|---|---|---|
| 1 | Rania AlHazmi UAE | 35-39 | 1:16:46 | |
| 2 | Lobna Elhalawani EGY | 40-44 | 1:18:35 | |
| 3 | Abrar Alteneiji UAE | 35-39 | 1:20:27 | |
| 4 | Ruby Harris GBR | 30-34 | 1:21:25 | |
| 5 | Fijke van Liempt NED | 45-49 | 1:22:01 | |
| 6 | Alice Newman GBR | 30-34 | 1:22:46 | |
| 7 | Hessa Kharbash UAE | 30-34 | 1:24:05 | |
| 8 | Fatima AlJabri QAT | 25-29 | 1:24:53 | |
| 9 | Noriane Rozales FRA | 35-39 | 1:25:36 | |
| 10 | Enas Alsanad KUW | 35-39 | 1:25:37 | |
| 11 | Amy Fabbo AUS | 30-34 | 1:26:30 | |
| 12 | Aziza Inil PHI | 25-29 | 1:26:33 | |
| 13 | Hajer Ali CAN | 25-29 | 1:27:27 | |
| 14 | Fatma Almheiri UAE | 35-39 | 1:27:31 | |
| 15 | Barbara Oerenc GER | 45-49 | 1:27:31 | |
| 16 | Shamma Altheeb UAE | 30-34 | 1:28:43 | |
| 17 | Lolwa al jassim QAT | 16-24 | 1:31:13 | |
| 18 | Heather Fisher GBR | 35-39 | 1:32:23 | |
| 19 | Tahani Abdulla BRN | 25-29 | 1:32:45 | |
| 20 | Kim Myers GBR | 40-44 | 1:33:13 | |
| 21 | Maryam Al Rawas UAE | 16-24 | 1:33:18 | |
| 22 | Shahad Alenezi KUW | 30-34 | 1:33:21 | |
| 23 | Bashayer Almeshaal KUW | 30-34 | 1:33:58 | |
| 24 | Caroline Tribble CAN | 35-39 | 1:34:26 | |
| 25 | Simona Consuelo Camerlenghi ITA | 60-64 | 1:35:09 | |
| 26 | Clara Charlotte Munte GER | 25-29 | 1:35:40 | |
| 27 | Kyle Holliday GBR | 40-44 | 1:35:58 | |
| 28 | Joan Steeman NED | 45-49 | 1:36:42 | |
| 29 | Rachel Gould USA | 45-49 | 1:37:41 | |
| 30 | Sumayyah Marit Raidvere EST | 35-39 | 1:41:16 | |
| 31 | Dhuha Ghuloum KUW | 30-34 | 1:41:28 | |
| 32 | Khaula Alshamsi UAE | 40-44 | 1:43:26 | |
| 33 | Olivia Ritchie IRL | 25-29 | 1:44:57 | |
| 34 | Oumayma Lemhamdi TUN | 30-34 | 1:45:28 | |
| 35 | DALAL ALARAIFI KUW | 30-34 | 1:45:59 | |
| 36 | Nora Adel EGY | 45-49 | 1:45:59 | |
| 37 | Sarah Abdulrahman UAE | 45-49 | 1:46:15 | |
| 38 | Sarah Priestley GBR | 16-24 | 1:47:29 | |
| 39 | Wasan AlKhamees KUW | 30-34 | 1:48:05 | |
| 40 | Sophie Johnson GBR | 50-54 | 1:48:17 | |
| 41 | Maryam Alkhuraibet KUW | 35-39 | 1:49:08 | |
| 42 | Marianna Cibotari MDA | 35-39 | 1:51:02 | |
| 43 | Sarah Qahtan UAE | 25-29 | 1:52:00 | |
| 44 | Mariam Binaskar UAE | 30-34 | 1:56:08 | |
| 45 | SASKIA ZEEMAN NED | 65-69 | 2:00:02 | |
| 46 | fatima binhidarah UAE | 25-29 | 2:00:35 | |
| 47 | Asma Lamali FRA | 30-34 | 2:03:06 | |
| 48 | Salha Khalifa UAE | 40-44 | 2:04:38 | |
| 49 | Shaikha Al Wahaibi OMA | 35-39 | 2:04:52 | |
| 50 | Aisha Al - Remithi QAT | 16-24 | 2:04:59 |
Or type your name above.
Finish times, Doubles · Friday
This chart shows how many athletes finished in each 2.5-minute band, fastest on the left.A widely spread field with a long slow tail: typical 1:39:43, middle half about 1:28:08 to 1:56:40, fastest 10% (green) under 1:22:00.
See the numbers
| Time band | How many | Share |
|---|---|---|
| 1:05:00 to 1:07:30 | 1 | 1.5% |
| 1:07:30 to 1:10:00 | 0 | 0.0% |
| 1:10:00 to 1:12:30 | 0 | 0.0% |
| 1:12:30 to 1:15:00 | 1 | 1.5% |
| 1:15:00 to 1:17:30 | 1 | 1.5% |
| 1:17:30 to 1:20:00 | 2 | 2.9% |
| 1:20:00 to 1:22:30 | 3 | 4.4% |
| 1:22:30 to 1:25:00 | 6 | 8.8% |
| 1:25:00 to 1:27:30 | 2 | 2.9% |
| 1:27:30 to 1:30:00 | 4 | 5.9% |
| 1:30:00 to 1:32:30 | 5 | 7.4% |
| 1:32:30 to 1:35:00 | 2 | 2.9% |
| 1:35:00 to 1:37:30 | 4 | 5.9% |
| 1:37:30 to 1:40:00 | 4 | 5.9% |
| 1:40:00 to 1:42:30 | 2 | 2.9% |
| 1:42:30 to 1:45:00 | 1 | 1.5% |
| 1:45:00 to 1:47:30 | 2 | 2.9% |
| 1:47:30 to 1:50:00 | 4 | 5.9% |
| 1:50:00 to 1:52:30 | 3 | 4.4% |
| 1:52:30 to 1:55:00 | 2 | 2.9% |
| 1:55:00 to 1:57:30 | 3 | 4.4% |
| 1:57:30 to 2:00:00 | 2 | 2.9% |
| 2:00:00 to 2:02:30 | 2 | 2.9% |
| 2:02:30 to 2:05:00 | 1 | 1.5% |
| 2:05:00 to 2:07:30 | 2 | 2.9% |
| 2:07:30 to 2:10:00 | 2 | 2.9% |
| 2:10:00 to 2:12:30 | 1 | 1.5% |
| 2:12:30 to 2:15:00 | 0 | 0.0% |
| 2:15:00 to 2:17:30 | 1 | 1.5% |
| 2:17:30 to 2:20:00 | 1 | 1.5% |
| 2:20:00 to 2:22:30 | 2 | 2.9% |
| 2:22:30 to 2:25:00 | 1 | 1.5% |
| 2:25:00 to 2:27:30 | 0 | 0.0% |
| 2:27:30 to 2:30:00 | 0 | 0.0% |
| 2:30:00 to 2:32:30 | 0 | 0.0% |
| 2:32:30 to 2:35:00 | 0 | 0.0% |
| 2:35:00 to 2:37:30 | 0 | 0.0% |
| 2:37:30 to 2:40:00 | 0 | 0.0% |
| 2:40:00 to 2:42:30 | 0 | 0.0% |
| 2:42:30 to 2:45:00 | 0 | 0.0% |
| 2:45:00 to 2:47:30 | 0 | 0.0% |
| 2:47:30 to 2:50:00 | 0 | 0.0% |
| 2:50:00 to 2:52:30 | 1 | 1.5% |
How to read
Each bar is how many finished in that time slot, fastest on the left, men and women together. Green is the fastest 10%; the line is the typical finish.
Or type your name above.
17 finishers in so far: too few for a typical time, so here is the list.
| # | Athlete | Age group | Time | |
|---|---|---|---|---|
| 1 | Nadia Udalova UKR | 35-39 | 1:09:13 | |
| 2 | Patricia Wardrop GBR | 45-49 | 1:14:37 | |
| 3 | Gada Shaikli IRQ | 45-49 | 1:15:53 | |
| 4 | Vitalina Chumachenko UKR | 35-39 | 1:16:52 | |
| 5 | Eman Elsharkawy EGY | 30-34 | 1:19:10 | |
| 6 | Natalie Luetic Galeazzi ARG | 45-49 | 1:20:30 | |
| 7 | Melanie Zochowski GER | 35-39 | 1:20:33 | |
| 8 | Tasneem Salie RSA | 35-39 | 1:21:39 | |
| 9 | Aysha Al-Melhim QAT | 25-29 | 1:29:22 | |
| 10 | Fynn Kwa SIN | 35-39 | 1:45:06 | |
| 11 | Karen McCrone GBR | 45-49 | 1:51:51 | |
| 12 | Hessa Ahmed UAE | 16-24 | 2:03:05 | |
| 13 | Kookie Saleh UAE | 45-49 | 2:03:59 | |
| 14 | Duaa Alhusain UAE | 45-49 | 2:10:28 | |
| 15 | Asya Alshehhi UAE | 30-34 | 2:18:08 | |
| 16 | Elena (HYROX_RUS) Popova | 30-34 | 2:28:10 | |
| 17 | Alyazia Alhajeri UAE | 30-34 | 3:12:07 |
21 teams in so far: too few for a typical time, so here is the list.
Finish times, Relay · Friday
This chart shows how many athletes finished in each 2.5-minute band, fastest on the left.A field of normal spread with the slower times close behind: typical 1:56:29, middle half about 1:48:08 to 2:04:38, fastest 10% (green) under 1:30:13.
See the numbers
| Time band | How many | Share |
|---|---|---|
| 1:15:00 to 1:17:30 | 1 | 1.8% |
| 1:17:30 to 1:20:00 | 0 | 0.0% |
| 1:20:00 to 1:22:30 | 1 | 1.8% |
| 1:22:30 to 1:25:00 | 0 | 0.0% |
| 1:25:00 to 1:27:30 | 1 | 1.8% |
| 1:27:30 to 1:30:00 | 3 | 5.5% |
| 1:30:00 to 1:32:30 | 1 | 1.8% |
| 1:32:30 to 1:35:00 | 0 | 0.0% |
| 1:35:00 to 1:37:30 | 2 | 3.6% |
| 1:37:30 to 1:40:00 | 2 | 3.6% |
| 1:40:00 to 1:42:30 | 0 | 0.0% |
| 1:42:30 to 1:45:00 | 1 | 1.8% |
| 1:45:00 to 1:47:30 | 1 | 1.8% |
| 1:47:30 to 1:50:00 | 3 | 5.5% |
| 1:50:00 to 1:52:30 | 3 | 5.5% |
| 1:52:30 to 1:55:00 | 5 | 9.1% |
| 1:55:00 to 1:57:30 | 4 | 7.3% |
| 1:57:30 to 2:00:00 | 2 | 3.6% |
| 2:00:00 to 2:02:30 | 7 | 12.7% |
| 2:02:30 to 2:05:00 | 5 | 9.1% |
| 2:05:00 to 2:07:30 | 3 | 5.5% |
| 2:07:30 to 2:10:00 | 4 | 7.3% |
| 2:10:00 to 2:12:30 | 1 | 1.8% |
| 2:12:30 to 2:15:00 | 1 | 1.8% |
| 2:15:00 to 2:17:30 | 0 | 0.0% |
| 2:17:30 to 2:20:00 | 0 | 0.0% |
| 2:20:00 to 2:22:30 | 1 | 1.8% |
| 2:22:30 to 2:25:00 | 1 | 1.8% |
| 2:25:00 to 2:27:30 | 1 | 1.8% |
| 2:27:30 to 2:30:00 | 0 | 0.0% |
| 2:30:00 to 2:32:30 | 0 | 0.0% |
| 2:32:30 to 2:35:00 | 0 | 0.0% |
| 2:35:00 to 2:37:30 | 0 | 0.0% |
| 2:37:30 to 2:40:00 | 0 | 0.0% |
| 2:40:00 to 2:42:30 | 1 | 1.8% |
How to read
Each bar is how many finished in that time slot, fastest on the left, men and women together. Green is the fastest 10%; the line is the typical finish.
Or type your name above.
The times to beat at Abu Dhabi
This chart shows how many athletes finished in each 2.5-minute band, fastest on the left.A field of normal spread with a long slow tail: typical 1:29:40, middle half about 1:20:01 to 1:43:00, fastest 10% (green) under 1:13:03.The marked line is fastest 25%: 1:20:02. The busiest band was 1:22:30 to 1:25:00.
See the numbers
| Time band | How many | Share |
|---|---|---|
| 57:30 to 1:00:00 | 1 | 0.2% |
| 1:00:00 to 1:02:30 | 3 | 0.5% |
| 1:02:30 to 1:05:00 | 5 | 0.9% |
| 1:05:00 to 1:07:30 | 9 | 1.6% |
| 1:07:30 to 1:10:00 | 10 | 1.7% |
| 1:10:00 to 1:12:30 | 27 | 4.7% |
| 1:12:30 to 1:15:00 | 20 | 3.5% |
| 1:15:00 to 1:17:30 | 32 | 5.5% |
| 1:17:30 to 1:20:00 | 37 | 6.4% |
| 1:20:00 to 1:22:30 | 36 | 6.2% |
| 1:22:30 to 1:25:00 | 44 | 7.6% |
| 1:25:00 to 1:27:30 | 33 | 5.7% |
| 1:27:30 to 1:30:00 | 35 | 6.1% |
| 1:30:00 to 1:32:30 | 29 | 5.0% |
| 1:32:30 to 1:35:00 | 40 | 6.9% |
| 1:35:00 to 1:37:30 | 27 | 4.7% |
| 1:37:30 to 1:40:00 | 27 | 4.7% |
| 1:40:00 to 1:42:30 | 14 | 2.4% |
| 1:42:30 to 1:45:00 | 19 | 3.3% |
| 1:45:00 to 1:47:30 | 14 | 2.4% |
| 1:47:30 to 1:50:00 | 15 | 2.6% |
| 1:50:00 to 1:52:30 | 4 | 0.7% |
| 1:52:30 to 1:55:00 | 8 | 1.4% |
| 1:55:00 to 1:57:30 | 11 | 1.9% |
| 1:57:30 to 2:00:00 | 7 | 1.2% |
| 2:00:00 to 2:02:30 | 9 | 1.6% |
| 2:02:30 to 2:05:00 | 10 | 1.7% |
| 2:05:00 to 2:07:30 | 6 | 1.0% |
| 2:07:30 to 2:10:00 | 8 | 1.4% |
| 2:10:00 to 2:12:30 | 5 | 0.9% |
| 2:12:30 to 2:15:00 | 4 | 0.7% |
| 2:15:00 to 2:17:30 | 3 | 0.5% |
| 2:17:30 to 2:20:00 | 5 | 0.9% |
| 2:20:00 to 2:22:30 | 1 | 0.2% |
| 2:22:30 to 2:25:00 | 2 | 0.3% |
| 2:25:00 to 2:27:30 | 2 | 0.3% |
| 2:27:30 to 2:30:00 | 2 | 0.3% |
| 2:30:00 to 2:32:30 | 3 | 0.5% |
| 2:32:30 to 2:35:00 | 2 | 0.3% |
| 2:35:00 to 2:37:30 | 2 | 0.3% |
| 2:37:30 to 2:40:00 | 2 | 0.3% |
| 2:40:00 to 2:42:30 | 0 | 0.0% |
| 2:42:30 to 2:45:00 | 0 | 0.0% |
| 2:45:00 to 2:47:30 | 1 | 0.2% |
| 2:47:30 to 2:50:00 | 1 | 0.2% |
| 2:50:00 to 2:52:30 | 0 | 0.0% |
| 2:52:30 to 2:55:00 | 0 | 0.0% |
| 2:55:00 to 2:57:30 | 0 | 0.0% |
| 2:57:30 to 3:00:00 | 0 | 0.0% |
| 3:00:00 to 3:02:30 | 0 | 0.0% |
| 3:02:30 to 3:05:00 | 0 | 0.0% |
| 3:05:00 to 3:07:30 | 0 | 0.0% |
| 3:07:30 to 3:10:00 | 0 | 0.0% |
| 3:10:00 to 3:12:30 | 0 | 0.0% |
| 3:12:30 to 3:15:00 | 0 | 0.0% |
| 3:15:00 to 3:17:30 | 0 | 0.0% |
| 3:17:30 to 3:20:00 | 2 | 0.3% |
This chart shows how many athletes finished in each 2.5-minute band, fastest on the left.A field of normal spread with a long slow tail: typical 1:33:22, middle half about 1:24:37 to 1:48:53, fastest 10% (green) under 1:19:10.The marked line is fastest 25%: 1:24:41. The busiest band was 1:22:30 to 1:25:00.
See the numbers
| Time band | How many | Share |
|---|---|---|
| 1:07:30 to 1:10:00 | 2 | 0.6% |
| 1:10:00 to 1:12:30 | 8 | 2.6% |
| 1:12:30 to 1:15:00 | 8 | 2.6% |
| 1:15:00 to 1:17:30 | 7 | 2.3% |
| 1:17:30 to 1:20:00 | 16 | 5.2% |
| 1:20:00 to 1:22:30 | 16 | 5.2% |
| 1:22:30 to 1:25:00 | 24 | 7.8% |
| 1:25:00 to 1:27:30 | 22 | 7.1% |
| 1:27:30 to 1:30:00 | 21 | 6.8% |
| 1:30:00 to 1:32:30 | 21 | 6.8% |
| 1:32:30 to 1:35:00 | 22 | 7.1% |
| 1:35:00 to 1:37:30 | 14 | 4.5% |
| 1:37:30 to 1:40:00 | 14 | 4.5% |
| 1:40:00 to 1:42:30 | 12 | 3.9% |
| 1:42:30 to 1:45:00 | 8 | 2.6% |
| 1:45:00 to 1:47:30 | 14 | 4.5% |
| 1:47:30 to 1:50:00 | 5 | 1.6% |
| 1:50:00 to 1:52:30 | 14 | 4.5% |
| 1:52:30 to 1:55:00 | 8 | 2.6% |
| 1:55:00 to 1:57:30 | 7 | 2.3% |
| 1:57:30 to 2:00:00 | 9 | 2.9% |
| 2:00:00 to 2:02:30 | 5 | 1.6% |
| 2:02:30 to 2:05:00 | 4 | 1.3% |
| 2:05:00 to 2:07:30 | 1 | 0.3% |
| 2:07:30 to 2:10:00 | 2 | 0.6% |
| 2:10:00 to 2:12:30 | 3 | 1.0% |
| 2:12:30 to 2:15:00 | 2 | 0.6% |
| 2:15:00 to 2:17:30 | 3 | 1.0% |
| 2:17:30 to 2:20:00 | 4 | 1.3% |
| 2:20:00 to 2:22:30 | 1 | 0.3% |
| 2:22:30 to 2:25:00 | 2 | 0.6% |
| 2:25:00 to 2:27:30 | 1 | 0.3% |
| 2:27:30 to 2:30:00 | 2 | 0.6% |
| 2:30:00 to 2:32:30 | 0 | 0.0% |
| 2:32:30 to 2:35:00 | 0 | 0.0% |
| 2:35:00 to 2:37:30 | 3 | 1.0% |
| 2:37:30 to 2:40:00 | 0 | 0.0% |
| 2:40:00 to 2:42:30 | 0 | 0.0% |
| 2:42:30 to 2:45:00 | 0 | 0.0% |
| 2:45:00 to 2:47:30 | 0 | 0.0% |
| 2:47:30 to 2:50:00 | 1 | 0.3% |
| 2:50:00 to 2:52:30 | 0 | 0.0% |
| 2:52:30 to 2:55:00 | 1 | 0.3% |
| 2:55:00 to 2:57:30 | 0 | 0.0% |
| 2:57:30 to 3:00:00 | 0 | 0.0% |
| 3:00:00 to 3:02:30 | 0 | 0.0% |
| 3:02:30 to 3:05:00 | 0 | 0.0% |
| 3:05:00 to 3:07:30 | 1 | 0.3% |
| 3:07:30 to 3:10:00 | 0 | 0.0% |
| 3:10:00 to 3:12:30 | 0 | 0.0% |
| 3:12:30 to 3:15:00 | 0 | 0.0% |
| 3:15:00 to 3:17:30 | 0 | 0.0% |
| 3:17:30 to 3:20:00 | 1 | 0.3% |
This chart shows how many athletes finished in each 2.5-minute band, fastest on the left.A field of normal spread: typical 1:20:16, middle half about 1:11:47 to 1:29:19, fastest 10% (green) under 1:05:48.The marked line is fastest 25%: 1:11:39. The busiest band was 1:22:30 to 1:25:00.
See the numbers
| Time band | How many | Share |
|---|---|---|
| 55:00 to 57:30 | 1 | 0.3% |
| 57:30 to 1:00:00 | 1 | 0.3% |
| 1:00:00 to 1:02:30 | 12 | 4.1% |
| 1:02:30 to 1:05:00 | 9 | 3.1% |
| 1:05:00 to 1:07:30 | 17 | 5.8% |
| 1:07:30 to 1:10:00 | 14 | 4.8% |
| 1:10:00 to 1:12:30 | 27 | 9.2% |
| 1:12:30 to 1:15:00 | 21 | 7.2% |
| 1:15:00 to 1:17:30 | 23 | 7.8% |
| 1:17:30 to 1:20:00 | 20 | 6.8% |
| 1:20:00 to 1:22:30 | 21 | 7.2% |
| 1:22:30 to 1:25:00 | 32 | 10.9% |
| 1:25:00 to 1:27:30 | 13 | 4.4% |
| 1:27:30 to 1:30:00 | 12 | 4.1% |
| 1:30:00 to 1:32:30 | 11 | 3.8% |
| 1:32:30 to 1:35:00 | 14 | 4.8% |
| 1:35:00 to 1:37:30 | 10 | 3.4% |
| 1:37:30 to 1:40:00 | 5 | 1.7% |
| 1:40:00 to 1:42:30 | 8 | 2.7% |
| 1:42:30 to 1:45:00 | 2 | 0.7% |
| 1:45:00 to 1:47:30 | 3 | 1.0% |
| 1:47:30 to 1:50:00 | 5 | 1.7% |
| 1:50:00 to 1:52:30 | 3 | 1.0% |
| 1:52:30 to 1:55:00 | 0 | 0.0% |
| 1:55:00 to 1:57:30 | 4 | 1.4% |
| 1:57:30 to 2:00:00 | 0 | 0.0% |
| 2:00:00 to 2:02:30 | 1 | 0.3% |
| 2:02:30 to 2:05:00 | 1 | 0.3% |
| 2:05:00 to 2:07:30 | 1 | 0.3% |
| 2:07:30 to 2:10:00 | 1 | 0.3% |
| 2:10:00 to 2:12:30 | 0 | 0.0% |
| 2:12:30 to 2:15:00 | 0 | 0.0% |
| 2:15:00 to 2:17:30 | 1 | 0.3% |
This chart shows how many athletes finished in each 2.5-minute band, fastest on the left.A field of normal spread: typical 1:30:51, middle half about 1:21:20 to 1:41:32, fastest 10% (green) under 1:15:45.The marked line is fastest 25%: 1:21:41. The busiest band was 1:30:00 to 1:32:30.
See the numbers
| Time band | How many | Share |
|---|---|---|
| 1:05:00 to 1:07:30 | 4 | 1.8% |
| 1:07:30 to 1:10:00 | 2 | 0.9% |
| 1:10:00 to 1:12:30 | 4 | 1.8% |
| 1:12:30 to 1:15:00 | 9 | 4.0% |
| 1:15:00 to 1:17:30 | 16 | 7.1% |
| 1:17:30 to 1:20:00 | 13 | 5.8% |
| 1:20:00 to 1:22:30 | 16 | 7.1% |
| 1:22:30 to 1:25:00 | 13 | 5.8% |
| 1:25:00 to 1:27:30 | 12 | 5.3% |
| 1:27:30 to 1:30:00 | 18 | 8.0% |
| 1:30:00 to 1:32:30 | 19 | 8.4% |
| 1:32:30 to 1:35:00 | 11 | 4.9% |
| 1:35:00 to 1:37:30 | 17 | 7.5% |
| 1:37:30 to 1:40:00 | 10 | 4.4% |
| 1:40:00 to 1:42:30 | 9 | 4.0% |
| 1:42:30 to 1:45:00 | 9 | 4.0% |
| 1:45:00 to 1:47:30 | 9 | 4.0% |
| 1:47:30 to 1:50:00 | 9 | 4.0% |
| 1:50:00 to 1:52:30 | 4 | 1.8% |
| 1:52:30 to 1:55:00 | 4 | 1.8% |
| 1:55:00 to 1:57:30 | 1 | 0.4% |
| 1:57:30 to 2:00:00 | 1 | 0.4% |
| 2:00:00 to 2:02:30 | 3 | 1.3% |
| 2:02:30 to 2:05:00 | 4 | 1.8% |
| 2:05:00 to 2:07:30 | 1 | 0.4% |
| 2:07:30 to 2:10:00 | 1 | 0.4% |
| 2:10:00 to 2:12:30 | 2 | 0.9% |
| 2:12:30 to 2:15:00 | 1 | 0.4% |
| 2:15:00 to 2:17:30 | 1 | 0.4% |
| 2:17:30 to 2:20:00 | 1 | 0.4% |
| 2:20:00 to 2:22:30 | 0 | 0.0% |
| 2:22:30 to 2:25:00 | 0 | 0.0% |
| 2:25:00 to 2:27:30 | 1 | 0.4% |
| 2:27:30 to 2:30:00 | 0 | 0.0% |
| 2:30:00 to 2:32:30 | 0 | 0.0% |
| 2:32:30 to 2:35:00 | 0 | 0.0% |
| 2:35:00 to 2:37:30 | 0 | 0.0% |
| 2:37:30 to 2:40:00 | 0 | 0.0% |
| 2:40:00 to 2:42:30 | 0 | 0.0% |
| 2:42:30 to 2:45:00 | 0 | 0.0% |
| 2:45:00 to 2:47:30 | 0 | 0.0% |
| 2:47:30 to 2:50:00 | 1 | 0.4% |
This chart shows how many athletes finished in each 2.5-minute band, fastest on the left.A field of normal spread with a long slow tail: typical 1:21:24, middle half about 1:13:41 to 1:31:31, fastest 10% (green) under 1:08:33.The marked line is fastest 25%: 1:13:42. The busiest band was 1:10:00 to 1:12:30.
See the numbers
| Time band | How many | Share |
|---|---|---|
| 57:30 to 1:00:00 | 1 | 0.4% |
| 1:00:00 to 1:02:30 | 8 | 3.3% |
| 1:02:30 to 1:05:00 | 5 | 2.1% |
| 1:05:00 to 1:07:30 | 7 | 2.9% |
| 1:07:30 to 1:10:00 | 9 | 3.7% |
| 1:10:00 to 1:12:30 | 22 | 9.1% |
| 1:12:30 to 1:15:00 | 18 | 7.4% |
| 1:15:00 to 1:17:30 | 22 | 9.1% |
| 1:17:30 to 1:20:00 | 21 | 8.7% |
| 1:20:00 to 1:22:30 | 16 | 6.6% |
| 1:22:30 to 1:25:00 | 20 | 8.3% |
| 1:25:00 to 1:27:30 | 15 | 6.2% |
| 1:27:30 to 1:30:00 | 9 | 3.7% |
| 1:30:00 to 1:32:30 | 14 | 5.8% |
| 1:32:30 to 1:35:00 | 14 | 5.8% |
| 1:35:00 to 1:37:30 | 2 | 0.8% |
| 1:37:30 to 1:40:00 | 10 | 4.1% |
| 1:40:00 to 1:42:30 | 3 | 1.2% |
| 1:42:30 to 1:45:00 | 6 | 2.5% |
| 1:45:00 to 1:47:30 | 2 | 0.8% |
| 1:47:30 to 1:50:00 | 3 | 1.2% |
| 1:50:00 to 1:52:30 | 4 | 1.7% |
| 1:52:30 to 1:55:00 | 0 | 0.0% |
| 1:55:00 to 1:57:30 | 1 | 0.4% |
| 1:57:30 to 2:00:00 | 2 | 0.8% |
| 2:00:00 to 2:02:30 | 1 | 0.4% |
| 2:02:30 to 2:05:00 | 1 | 0.4% |
| 2:05:00 to 2:07:30 | 1 | 0.4% |
| 2:07:30 to 2:10:00 | 0 | 0.0% |
| 2:10:00 to 2:12:30 | 2 | 0.8% |
| 2:12:30 to 2:15:00 | 1 | 0.4% |
| 2:15:00 to 2:17:30 | 0 | 0.0% |
| 2:17:30 to 2:20:00 | 0 | 0.0% |
| 2:20:00 to 2:22:30 | 0 | 0.0% |
| 2:22:30 to 2:25:00 | 0 | 0.0% |
| 2:25:00 to 2:27:30 | 0 | 0.0% |
| 2:27:30 to 2:30:00 | 0 | 0.0% |
| 2:30:00 to 2:32:30 | 1 | 0.4% |
| 2:32:30 to 2:35:00 | 0 | 0.0% |
| 2:35:00 to 2:37:30 | 0 | 0.0% |
| 2:37:30 to 2:40:00 | 0 | 0.0% |
| 2:40:00 to 2:42:30 | 1 | 0.4% |
This chart shows how many athletes finished in each 2.5-minute band, fastest on the left.A field of normal spread with a long slow tail: typical 1:19:37, middle half about 1:11:45 to 1:30:56, fastest 10% (green) under 1:07:56.The marked line is fastest 25%: 1:11:50. The busiest band was 1:10:00 to 1:12:30.
See the numbers
| Time band | How many | Share |
|---|---|---|
| 57:30 to 1:00:00 | 5 | 4.0% |
| 1:00:00 to 1:02:30 | 2 | 1.6% |
| 1:02:30 to 1:05:00 | 1 | 0.8% |
| 1:05:00 to 1:07:30 | 3 | 2.4% |
| 1:07:30 to 1:10:00 | 9 | 7.2% |
| 1:10:00 to 1:12:30 | 16 | 12.8% |
| 1:12:30 to 1:15:00 | 9 | 7.2% |
| 1:15:00 to 1:17:30 | 9 | 7.2% |
| 1:17:30 to 1:20:00 | 10 | 8.0% |
| 1:20:00 to 1:22:30 | 6 | 4.8% |
| 1:22:30 to 1:25:00 | 6 | 4.8% |
| 1:25:00 to 1:27:30 | 11 | 8.8% |
| 1:27:30 to 1:30:00 | 6 | 4.8% |
| 1:30:00 to 1:32:30 | 2 | 1.6% |
| 1:32:30 to 1:35:00 | 3 | 2.4% |
| 1:35:00 to 1:37:30 | 3 | 2.4% |
| 1:37:30 to 1:40:00 | 2 | 1.6% |
| 1:40:00 to 1:42:30 | 4 | 3.2% |
| 1:42:30 to 1:45:00 | 3 | 2.4% |
| 1:45:00 to 1:47:30 | 3 | 2.4% |
| 1:47:30 to 1:50:00 | 3 | 2.4% |
| 1:50:00 to 1:52:30 | 2 | 1.6% |
| 1:52:30 to 1:55:00 | 3 | 2.4% |
| 1:55:00 to 1:57:30 | 2 | 1.6% |
| 1:57:30 to 2:00:00 | 2 | 1.6% |
This chart shows how many athletes finished in each 2.5-minute band, fastest on the left.A widely spread field with a long slow tail: typical 1:26:07, middle half about 1:17:25 to 1:42:49, fastest 10% (green) under 1:13:06.The marked line is fastest 25%: 1:17:29. The busiest band was 1:15:00 to 1:17:30.
See the numbers
| Time band | How many | Share |
|---|---|---|
| 1:02:30 to 1:05:00 | 1 | 2.0% |
| 1:05:00 to 1:07:30 | 1 | 2.0% |
| 1:07:30 to 1:10:00 | 1 | 2.0% |
| 1:10:00 to 1:12:30 | 2 | 3.9% |
| 1:12:30 to 1:15:00 | 1 | 2.0% |
| 1:15:00 to 1:17:30 | 7 | 13.7% |
| 1:17:30 to 1:20:00 | 6 | 11.8% |
| 1:20:00 to 1:22:30 | 0 | 0.0% |
| 1:22:30 to 1:25:00 | 4 | 7.8% |
| 1:25:00 to 1:27:30 | 6 | 11.8% |
| 1:27:30 to 1:30:00 | 1 | 2.0% |
| 1:30:00 to 1:32:30 | 1 | 2.0% |
| 1:32:30 to 1:35:00 | 4 | 7.8% |
| 1:35:00 to 1:37:30 | 2 | 3.9% |
| 1:37:30 to 1:40:00 | 1 | 2.0% |
| 1:40:00 to 1:42:30 | 0 | 0.0% |
| 1:42:30 to 1:45:00 | 2 | 3.9% |
| 1:45:00 to 1:47:30 | 2 | 3.9% |
| 1:47:30 to 1:50:00 | 0 | 0.0% |
| 1:50:00 to 1:52:30 | 1 | 2.0% |
| 1:52:30 to 1:55:00 | 0 | 0.0% |
| 1:55:00 to 1:57:30 | 2 | 3.9% |
| 1:57:30 to 2:00:00 | 0 | 0.0% |
| 2:00:00 to 2:02:30 | 0 | 0.0% |
| 2:02:30 to 2:05:00 | 0 | 0.0% |
| 2:05:00 to 2:07:30 | 1 | 2.0% |
| 2:07:30 to 2:10:00 | 1 | 2.0% |
| 2:10:00 to 2:12:30 | 1 | 2.0% |
| 2:12:30 to 2:15:00 | 0 | 0.0% |
| 2:15:00 to 2:17:30 | 0 | 0.0% |
| 2:17:30 to 2:20:00 | 0 | 0.0% |
| 2:20:00 to 2:22:30 | 1 | 2.0% |
| 2:22:30 to 2:25:00 | 0 | 0.0% |
| 2:25:00 to 2:27:30 | 0 | 0.0% |
| 2:27:30 to 2:30:00 | 0 | 0.0% |
| 2:30:00 to 2:32:30 | 2 | 3.9% |
Course notes
- Running was 48% of the typical finish: normal. Your splits compare cleanly with other races.
- The fastest 25% gained most on the runs; of the stations, wall balls.
- Sandbag lunges ran 0:26 slower here than at a typical venue.
Before you go
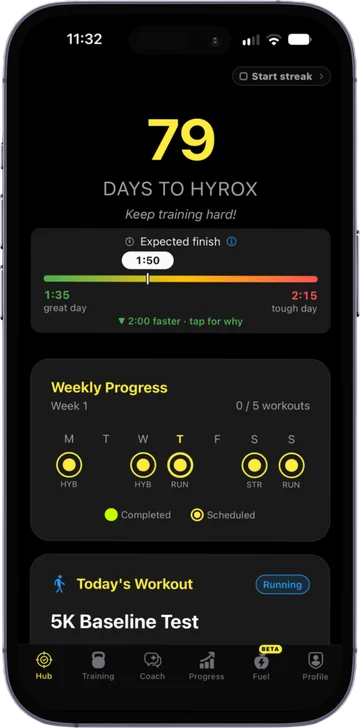
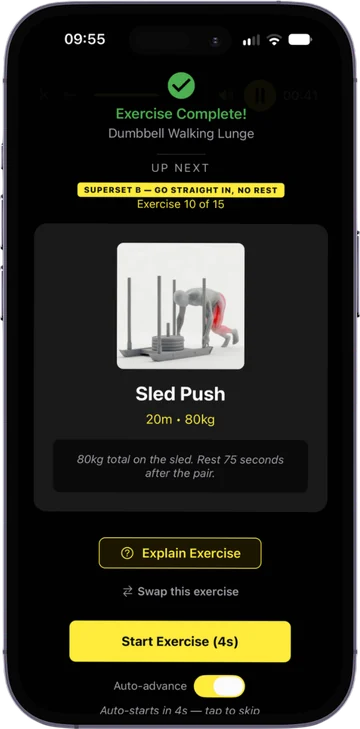
Raced Abu Dhabi? Train for your next race and beat this time.
The RoxHype app is your training plan to race day: built from your splits, your kit and your race date, and adjusted every week.
- A week-by-week plan that counts down to your race
- Extra work on your slowest stations
- Adjusts every week to what you actually did
Free to download. Used by more than 40,000 HYROX athletes.